


Games Are Too Long
Here's what to do about it. Plus a Q&A with a plus-minus purist


Yesterday, all 30 teams played. Not a single game finished under two hours.
The Knicks and Hawks needed two and half hours just to complete regulation. Then they needed another 25 minutes to finish a five minute overtime period.
Later that night, the Mavericks and Warriors tipped off at 9:44 PM (EST) and didn’t finish until two and half hours later at 12:13 AM. RIP to my Eastern Coast brethren.
As someone who watches basketball almost every day, you might think it odd for me to complain about the growing length of NBA games, calling out a hobby that brings me entertainment, serotonin, and my joie de vivre. But even I, a severe NBA-holic, have started to feel that games are getting a teensy-tiny bit too long.
On the collegiate level, Ken Pomeroy had a piece last week on his Substack where he detailed the increasing length of college basketball games:
The biggest problem left in college hoops is its end game. How much of a problem is a matter of taste. But for the past six seasons, I’ve been tracking game length and if you think games are getting longer, you’re correct. This is the average game length for regular-season power-conference games (non-overtime) over that time:
2020 1:59:38
2021 1:58:49
2022 2:00:33
2023 2:01:03
2024 2:02:21
2025 2:04:35As of Monday, average game time is up 2 minutes and 14 seconds over last season. That isn’t exactly significant in the grand scheme of life but it’s possibly the longest games have ever been. Because last year, game times were up 1:18 over 2023, and game times for 2023 were up 30 seconds over 2022, and game times for 2022 were up 1:44 over 2021. It’s officially a trend. Game times are up nearly six minutes since 2021.
Inspired by Pomeroy’s findings I looked into how the length of NBA games has changed over a similar time period. Using the NBA’s play-by-play data, which has real timestamps down to the exact second for every action in a given game, I measured the time elapsed between the beginning of the first quarter and end of the fourth quarter for every regular season game since the 2020-21 season.
Here are the average lengths of non-overtime games by season1:
2020-21: 2:12:40
2021-22: 2:13:21
2022-23: 2:14:19
2023-24: 2:13:36
2024-25: 2:15:07
Similar to the college game, NBA game times are increasing as of late.
[BIG FAT CAVEAT: The data I used for this analysis comes from a source that has only been around since the 2019-20 season2. There’s a different data source that goes back much further, but its timestamps are not as precise because they’re rounded to the nearest minute as opposed to the nearest second. When Mike Beuoy looked at that data, which rounds to the nearest minute, he found that the average game length is actually about two minutes shorter than the high in 2009-10.]
Compared to last year, NBA game times are up about 90 seconds on average. If every game were 90 seconds longer no one would notice. The issue is that these days there are more games that are taking an especially long time to complete.
For example, last year, 40 games took more than 2.5 hours to finish. This year, we’ve already seen 37 games take more than 2.5 hours to finish. That’s not reaching The Brutalist run time but we’re not too far off either.
I can’t prove it definitively3, but I believe the main culprit for the rise in game lengths this season is the proliferation of coach’s challenges. Introduced before the 2019-20 season, the coach’s challenge gives teams the opportunity to call a timeout to challenge a referee’s ruling on the court. The NBA expanded that rule before the 2023-24 season to give coaches a second challenge if their first is successful.
This season, we’re seeing 1.3 challenges per game, on average. That’s up from 1.0 last season and double from two seasons ago when teams were limited to a single challenge per game.
The chart below shows the relationship between how long a game runs on average (y-axis) and how many challenges were used in the game (x-axis) for each year that we have data. In case it wasn’t obvious, more challenges are associated with longer games.
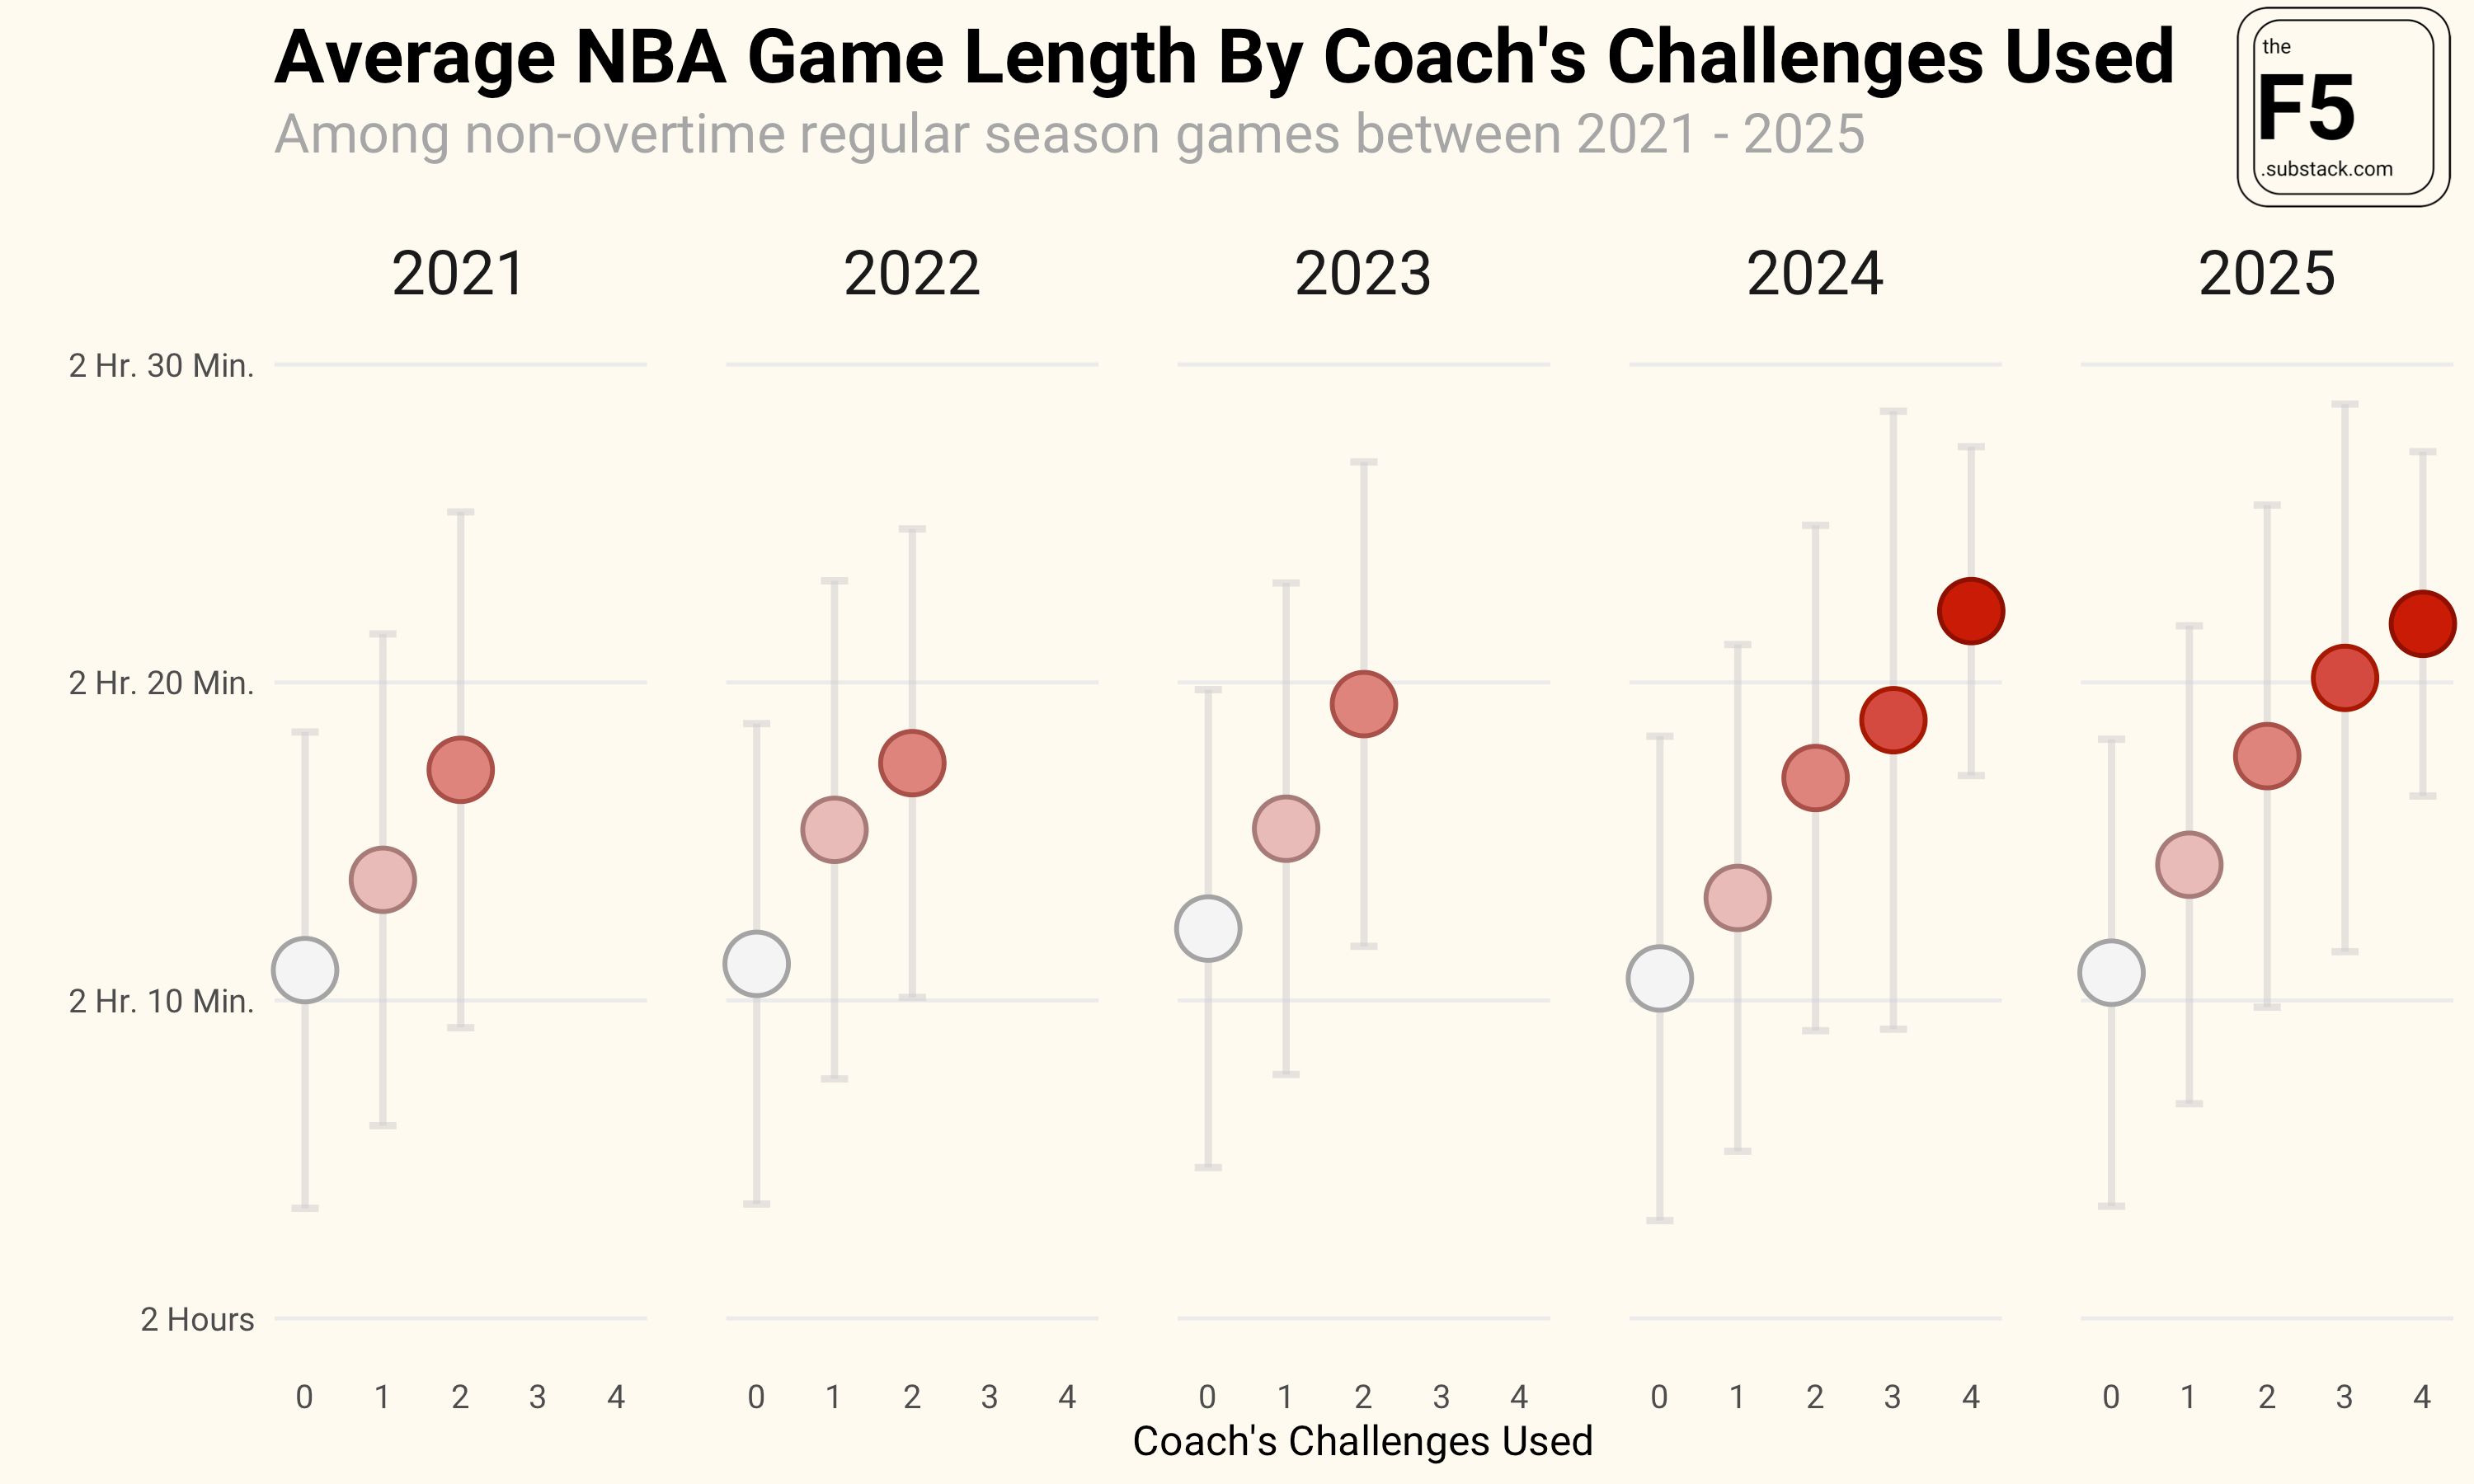
Ideally, challenges shouldn’t have much of an effect on the length of the game since they take place during a timeout that was likely going to occur anyway. However, challenge-induced timeouts often take longer than non-challenge-induced timeouts.
A typical timeout rarely, if ever, lasts more than three and half minutes of real time. Meanwhile, there’s no limit to how long a challenge-induced timeout can take. If Scott Foster wants to stand at the monitor and take his time to make sure he gets the call right, he can. If Bill Kennedy wants to practice his NPR voice when he announces the results of a challenge with dramatic pauses, he can. Challenges can go on for as long as a referee deems necessary. So it’s no wonder, then, that the more challenges a game has the longer it tends to be.
Kevin Pelton told me during our Q&A that if he could make one rule change he would enforce a strict limit on how long reviews can take:
That said, if you give me one rule change, I'm limiting reviews to a maximum of 30 seconds. The longer a review goes, the more the returns diminish in terms of improving the call on the court.
Pelton’s suggestion is a good one. But I’d take it a step further: get rid of challenges and reviews all together. It’s a time suck that marginally increases the overall accuracy of, at most, a couple of calls a game at the expense of making the games themselves noticeably less enjoyable to watch. According to the NBA’s own data, just 61 percent of challenges this year have resulted in an overturned call. Is that number high enough to justify the disruption to the game?
Few things are worse as a fan than watching the air go out of a game when a high leverage moment gets deflated by a challenge and lengthy review. Not to mention the countless number of challenges that are only used because team has a challenge available and not because they think they’ll get a call overturned.
If Adam Silver wants to get games under two hours then getting rid of the challenge would be a good place to start. At worst it results in a few bad calls that stand (like we don’t see that already). At best we get a few minutes of our lives back for each game we watch.
For more analysis of NBA game lengths I recommend browsing the archives on inpredictable.com. Mike Beuoy has done substantial work on this topic, including a detailed analysis of how long each minute of NBA game time actually takes.

A Refreshing Interview With the Creator of nbarapm.com
Every year, a new NBA stats site pop sup promising users a new way to look at NBA data. Rarely do they do deliver anything better than what you can find on basketball-reference.com or pbpstats.com But this year I stumbled across nbarapm.com and it’s quickly become one of my favorite basketball sites to look at.
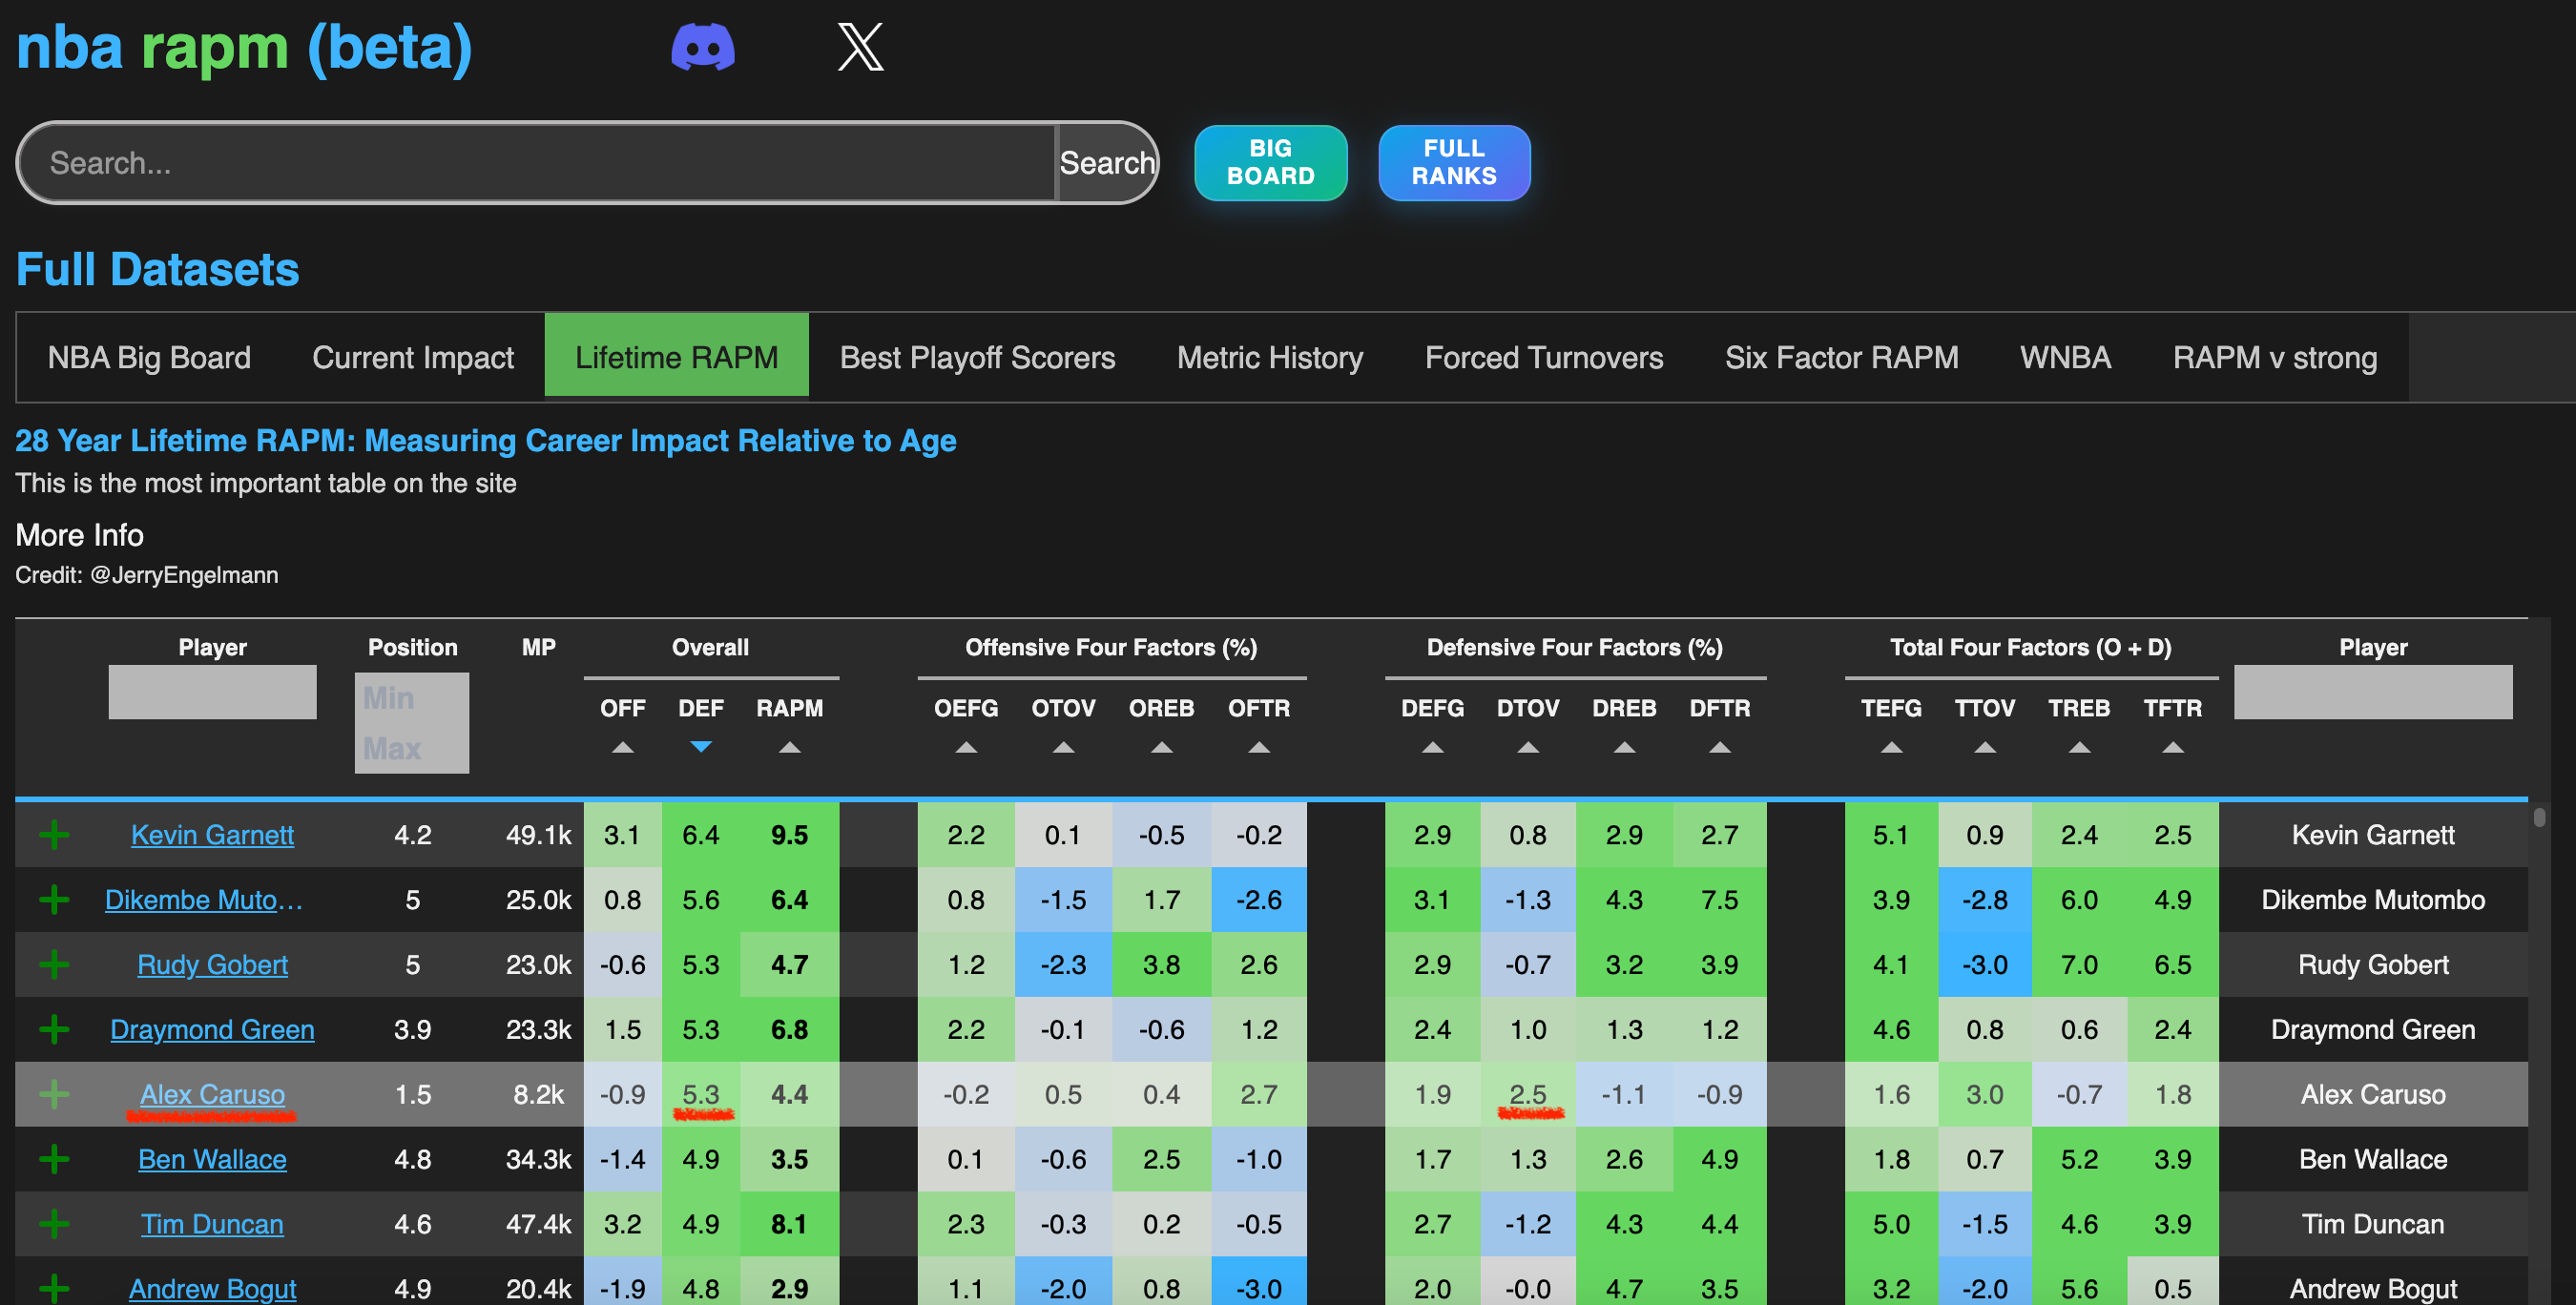
nbarapm.com takes its name from Regularized Adjusted Plus Minus (RAPM), which estimates a player’s impact on the scoring margin after controlling for the strength of a player’s teammates and their opponents. RAPM is the foundation of most of the basketball intelligentsia’s favorite all-in-one metrics so it’s fitting that it’s also the backbone of what makes nbarapm.com so useful.
On nbarapm.com users can see what a player’s impact is on the scoring margin, scoring efficiency, free throws, rebounding, and turnovers — both on offense and on defense. (This is similar to what you used to be able to find on Ryan Davis’ nbashotcharts.com, but that site is no longer maintained).
For example, nbarapm.com allows us to see more clearly that the reason Nikola Jokic is considered a valuable defensive player despite being a poor rim protector is because of his defensive rebounding. It’s not sexy, but being good at defensive rebounds means fewer second chance opportunities for your opponents and fewer points allowed overall.

I wanted to learn more about nbarapm.com so I reached out to its creator who goes by databallr on twitter. We talked about Alex Caruso, Heroes of the Storm, and what you can only find on nbarapm.com and nowhere else.
This Q&A has been edited for length and clarity.
F5: What’s the backstory on nbarapm.com? Why did you decide to create it?
databallr: I became more interested in NBA analytics in 2023. I first discovered RAPM on nbashotcharts.com by Ryan Davis. I found the data very interesting, particularly the regularized adjusted four factor data. I devised a method to distribute the O-RAPM and D-RAPM to 3 categories (impact on team True Shooting, Turnovers, and Offensive Rebounding). I wasn’t really satisfied with how the data could be viewed on nbashotcharts and Ryan announced he was shutting the site down, so i made my first attempt at a website (desktop only).
I thought this was a pretty enlightening way to view the data, because it makes it the RAPM data much more auditable. You now value aspects of a player’s game like Chris Paul’s historic impact on the net turnover rate. These are aspects of the game that are not necessarily flashy but very valuable.

I decided to build a new site and create player profiles and incorporate some advanced boxscore stats. The site was really just a way for me to organize all the information I wanted to see, I’m definitely one of the biggest users.
What’s your background?
I have a degree in a quantitative field but my background is really in games. I played poker professionally for many years after college. I also was a #1 ranked player in a 5v5 MOBA video game. I credit some of my edge in understanding what builds were undervalued based on my reading of the metrics. I picked up python in late 2022 and got hooked grinding leetcode competitions for about 5-6 months straight.
I became a lot more interested in the NBA around that time while watching Nikola Jokic’s historic 2023 season and started to experiment building websites and metrics.
Something about NBA analytics really speaks to me because there are numerous parallels in both poker (bb/100 -> rapm, the concept of leaks, redline) and MOBAs (5v5, metrics, diff archetypes, [ladder vs pro play] : [rs vs playoffs] ).
I also played a ton of basketball as a kid so i feel like i’ve come full circle.
Which MOBA game were you ranked #1 in? Are there any lessons from 5v5 MOBA Video games that you think could be applied to NBA team building or on-court/ingame strategies?
Heroes of the Storm. I don’t really want to make much of the comparison. Just that I have an appreciation for the non-boxscore.
5v5 team games are about communication and awareness – those things aren’t necessarily captured by stats. There’s a very important macro game at play (possession game) that I think has been overlooked at times by some teams. In MOBA’s, sometimes teams draft too much around building the best teamfight comp and just lose on the map because of a poor macro game.
The professional poker player to sports analytics pipeline is very robust. Why do you think that is?
There’s a crossover between poker and sportsbetting (gambling), so it’s not that surprising. Online Poker attracts a nerdy crowd and the game at the top level is effectively academic at this point. The use of analytics in poker is very helpful in understanding how your opponent is likely to play which allows you to play an exploitative strategy to maximize profit.
Whats something on nbarapm.com you cant find elsewhere?
There’s tons of stuff:
Playoff adjusted rTS% - True Shooting Percentage (TS%) relative to series opponent regular season TS% Allowed. The average TS% has gone up over the years, so it’s quite hard to understand just how efficient some players were in less efficient eras especially when they were facing elite defenses. Some of these opponents were allowing less than 50% TS in the regular season. I have this by series on the playoff tab for each player.
STOP% metric - this is a defensive metric created by me which simply sums steals, offensive fouls drawn, and blocks (recovered by the defense) per 100. I think this stat is a pretty incredible NBA boxscore stat, because of its simplicity and what it tells you: precisely what percentage of the time the opponent received a guaranteed zero points on a possession because of an outstanding defensive play the player makes.

League leaders in STOP% (minimum 500 MP). Checks out. Regularized adjusted 6 factor data going back to 2001 for all durations of 2 through 6 years.
On-off data where everything is measured relative to league average. I love Cleaningtheglass.com and I credit it massively for improving my understanding of the game, but I needed to see the data relative to league average. It isn’t enough to see the percentiles for me. I want to see whether Nash had a +14 rORTG in 2005 or a +10 one, they are both 99th percentile values.

I have split True Shooting Percentage (TS%) into Creation TS%, Spacing TS%, and Finishing TS%, where I split the playtype data into 3 buckets. This is kind of a theme of my site. I like taking 1 number metrics and splitting them into 3 other metrics that roll up to the bigger one. It makes the numbers far more interesting and improves understanding. For instance, when you do it this way, you will find out that a big source of Cade Cunningham’s inefficiency is actually not in his halfcourt creation, but in his Finishing TS% efficiency driven by his poor transition TS% and TS% in other garbageman playtypes.


I'm intrigued by the RAPM vs strong and weak table on your site. Can you tell me more about that?
This was inspired by Canzhi Ye’s thread on adding covariates to RAPM.
RAPM is an estimate of a player’s average value against the league over some duration. A player improves his RAPM by winning his minutes by as much as possible. I added a covariate for whether the player was facing a strong lineup4 or a weak lineup5.
Someone’s playstyle could be more valuable vs. weak competition than vs. strong competition. The concept of ‘playoff droppers’ is hard to prove out when the playoff samples are so small, so I was trying to incorporate regular season data with this method.
Rudy Gobert is a notable dropper in these RAPMs, on both offense and defense. Gobert gets a lot of shit from players around the league and fans for not being as good as his DPOY reputation… and maybe they are right? There’s a clip with Jeff Bezos where he says when the metrics disagree with the anecdotes, sometimes there’s an issue in what you are measuring. He’s still been very valuable overall, but it’s not too hard to imagine that his play style is more valuable vs weak competition.
It’s intuitive to me that his rim deterrence and protection carry more value against teams that can’t shoot well from the perimeter. I once wrote that Rudy is Scoot Henderson’s worst nightmare, meaning, I think Rudy’s defensive value really goes through the roof against bad point guards (I wrote that before Scoot had improved). On offense, Rudy is very limited and I think smart defenders can magnify his weaknesses.
On the other hand, Draymond is known for being a playoff raiser and according to Steve Kerr ‘one of the worst meaningless game players’. In the weak/medium/strong version, you see Draymond is actually worse vs weak competition and better vs strong. Draymond is very much justified in thinking he’s better than Rudy Gobert as a defender, because he has much better results against tougher competition.
Right now your site is in "beta" -- what’s in store for the future?
This was not going to be the final version of the site, I’ve learned a lot along the way and have been wanting to rewrite the site to have a much better backend and frontend. This current site was a big learning experience for me I’m releasing a new site on March 1st packed with a bunch of different tools/stats.
Whats the end goal with your site? Will you eventually put some of the content behind a paywall to make money from it? Or is this really just meant to be a portfolio project you can share with future employers?
Not interested in putting a paywall up for anything on the current site. My site is very niche for the super NBA nerd who wants to see all the data. If my next version of the site generates significant traffic I will monetize it. It’s definitely a portfolio project for me.
Which team do you root for?
I root for the Thunder, partially because I placed my biggest bet on over 57.5 wins this season, and also because Alex Caruso is one of my favorite players.
In the summer of 2022, Lakers decided not to pay Alex Caruso despite him having insane D-RAPM and defensive boxscore stats. I was curious to see his impact on the Bulls, and have watched a ton of Bulls games the last few years. It was evident from the first few games the Lakers had made a massive mistake. I watched him carry that Bulls defense for 3 years and was really hoping for him to get traded to a contender. OKC was the perfect fit.
On offense, he’s best when he’s next to a ball dominant star. I believe Caruso still holds the title of being LeBron’s best duo in terms of net rating (+16.5 including playoffs). This year with SGA? +28 net rating.
On defense, adding the player who increases the opponents turnover rate more than anyone else (+2.5%) in the modern era to the best team at forcing turnovers was an interesting experiment.
Does it stack linearly at this extreme? Are there diminishing returns? Or the opposite? If you think about how steals are created, oftentimes it’s the ‘pressure’ forcing someone into a mistake. You can think about it like an accumulation of defensive advantages. When you have a bunch of pressure guards, like OKC does, I think the sum is greater than the parts on defense.
You’re anonymous (as far as i can tell). Why?
Not really that anonymous, but I tweet more freely under this name and don’t want to tweet super technical NBA stuff from a different account where the followers are not NBA related.
What’s one thing you cant live without during the NBA season?
I enjoy the Thinking Basketball youtube channel, podcast, and the ThinkingBasketball discord. Great community.
Mike Beuoy has found that there are some seasonal effects with game lengths so I also checked to see how the first 800 games played this year compares to the first 800 games from previous years:
2020-21: 2:12:49
2021-22: 2:12:58
2022-23: 2:14:54
2023-24: 2:14:42
2024-25: 2:15:07
Not as dramatic, but still an increase of about 25 seconds this season.
This specific type of play-by-play data goes back to 2019-20 but I haven’t been able to assemble a complete dataset of that season. I’ve got the data for about 75% of the games that year and for the games I do have the average game length is 2:14:49, or about 17 seconds shorter than the average game during the 2024-25 season. I suspect one reason the length of the games in 2019-20 is longer than the following years is because that was the year they introduced the coach’s challenge and perhaps officials took their time reviewing calls that first year.
The reason I say I can’t prove it definitively is because I expected to see the average game length in 2023-24 to have been higher than in 2022-23. If coach’s challenges lead to longer games than the extra challenge that was introduced in 2023-24 should have made games longer. But I don’t see evidence of that. That could be noise. Or it could mean my theory is wrong. I genuinely don’t know!
opponent lineup DARKO DPM summed to +0 or higher
opponent lineup DARKO DPM summed summed to less than 0
I really like the pairing of an analysis from you and then an interview!
databallr has been one of my new favorite follows on Twitter this season