
Hot Shots
Mapping the stars' favorite (and least favorite) spots on the court

Talking heads keep complaining that everyone plays the same. Funny, because I keep thinking every talking head sounds the same.
One reason critics think everyone plays the same is because shot selection across the league has gotten more homogeneous in recent years. Everyone’s hunting layups and threes. That’s mostly true on a macro level, but that kind of overgeneralization obscures what’s happening on an individual level.
If you want to tease out what makes a player unique, you’ll have a hard time doing so by looking at traditional shot charts; they all kind of look the same with some minor differences here and there. That’s why I prefer a different type of shot chart that brings the differences between players into stark relief.
The chart below shows the areas of the court that each team’s leading scorer likes (and dislikes) shooting from. Instead of mapping a player’s total shot attempts, this chart maps their relative shot attempts compared to a theoretical league average player.

The darker and denser the red area, the more often the corresponding player shoots from that location relative to the rest of the league. Meanwhile, the gray areas indicate the areas where a player shoots from less often relative to their peers. The areas with no color are just the spots where that player’s shot selection mirrors the average player’s shot selection.
For instance, take a look at the hot spot 30-feet from the hoop on Trae Young's chart. Those are his patented logo threes. Young has attempted 157 shots from 30-feet or beyond this season (the next closest is LaMelo Ball with 66). But don’t let the volume distract you from the fact that Young shoots like shit on those deep bombs. He’s made just 25 percent of his ill-advised threes this season.

In that same vein, these charts don’t say anything about how effective a player shoots from these locations. Nor do they provide any information on the types of actions that preceded (or followed) the shots. Still, I find them useful because they reveal some of the quirks that make a player unique that even a causal viewer can pick up on after a few minutes of watching a game.
So let’s run through a few individual charts and I’ll try to provide a bit of context and commentary as we go along.
Ever since Taylor Jenkins took over as Memphis’ head coach, the Grizzlies have been synonymous with floaters. From 2019-20 to today, Memphis has attempted over 1,000 more shots from floater range than the next closest team. This season is no different as the Grizzlies are once again leading the league in shots from the short midrange. A big part of that is Jaren Jackson Jr’s evolution as a scorer. He’s averaging the most points of career by making a living in the space between the restricted area and the foul line. As of this writing, he leads a players in attempts from floater range while converting 52 percent of those shots.


It’s common to see more action in the midrange on these charts than you would typically find on a traditional shot chart. By accentuating the areas of the court that are different from the league average, these charts highlight the hero ball shots that are reserved for top-end shot makers.
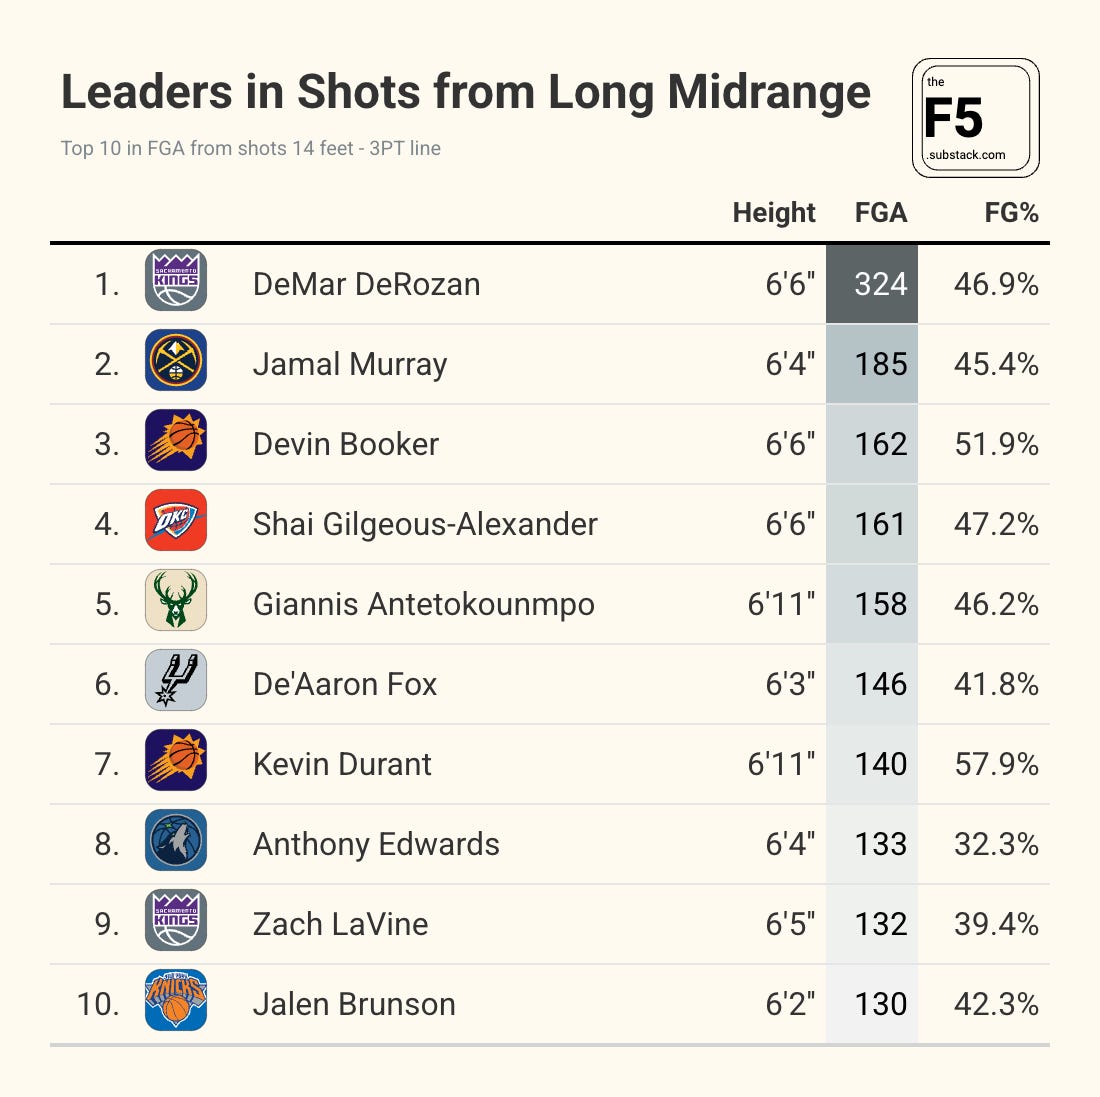
The clearest example of this is DeMar DeRozan’s chart, where you’ll find a heavy concentration of red inside the three-point arc due to his league-leading 324 midrange attempts. You can find a similar pattern on Kevin Durant’s and Shai Gilgeous-Alexander’s charts, but I think the neat thing about these charts is that each one is truly distinct. DeRozan’s wants to get to his spots outside the elbows and on the baseline. Durant’s hot spots are foot inside the foul line. Meanwhile, SGA is the only one of these three mid-range masters that also regularly gets to the rim.

It’s a small thing, but I’m drawn to the little red blob on the right wing three on Jalen Brunson’s chart. Anytime he comes of a pick he’s looking for that shot. He knows it. The opponent knows it. Hell, even you probably know it. Since joining the Knicks, Brunson has attempted twice as many threes from the right wing than the left wing. Defenders are so worried about him getting into the paint they’ll forget to defend him like the elite pull-up three-point shooter that he is. This season he’s making 39 percent of his pull-up threes, seventh best among players that have attempted at least 100 such shots.


Nikola Jokic’s chart is just a straight line path down the middle of the court. It’s almost as if he has to be in perfect alignment with the basket before he takes a shot. Is this secret to his otherworldly efficiency? Probably not. I think this pattern is mostly a byproduct of how he constantly positions himself in the center of the court to serve as a passing hub for teammates. But when the shot clock is winding down, he’s comfortable taking matters into his own hands. Jokic is shooting 50 percent on threes (omitting heaves) when the shot clock is under seven seconds this season. A convenient failsafe to say the least.

There’s also some insights we can glean by focusing on the areas of the court where these players tend to avoid. Specifically, the gray areas, which indicate where a given player dislikes shooting from (again, relatively speaking).
For instance, let’s look at Giannis Antetokounmpo’s chart. He deserves credit for cutting out the threes this season after years of fans begging him to do so. Antetokounmpo has swapped threes this year for more manageable midranges. He’s not Kevin Durant from the midrange by any means, but shooting 45 percent on long twos is better than the sub-30 percent on bad threes we had grown accustomed to seeing from Antetokounmpo each season.

I can see some people looking at Victor Wembanyama’s chart with disgust. Look at all that gray near the rim! Wemby is a bonafide chucker at heart. He might one day become a better version of Giannis offense, but right now he’s closer to a 7’4’’ Cam Thomas. That’s why teams are comfortable sticking defenders like Dillon Brooks on him. They know he’s reluctant to use his height to punish defenders and will settle for off the dribble threes. It took Giannis until this year to figure out he didn’t need a three-point shot to dominate. How long will it take Wemby?

In fairness, Wemby is a better shooter now than Giannis has ever been. He’s currently shooting 37 percent on catch-and-shoot threes. Giannis has shot above 35 percent on catch-and shoot-threes only once in his career (36 percent in 2019-20). Wemby doesn’t need to cut out threes entirely. He just needs to pump the brakes a bit on the especially audacious ones.

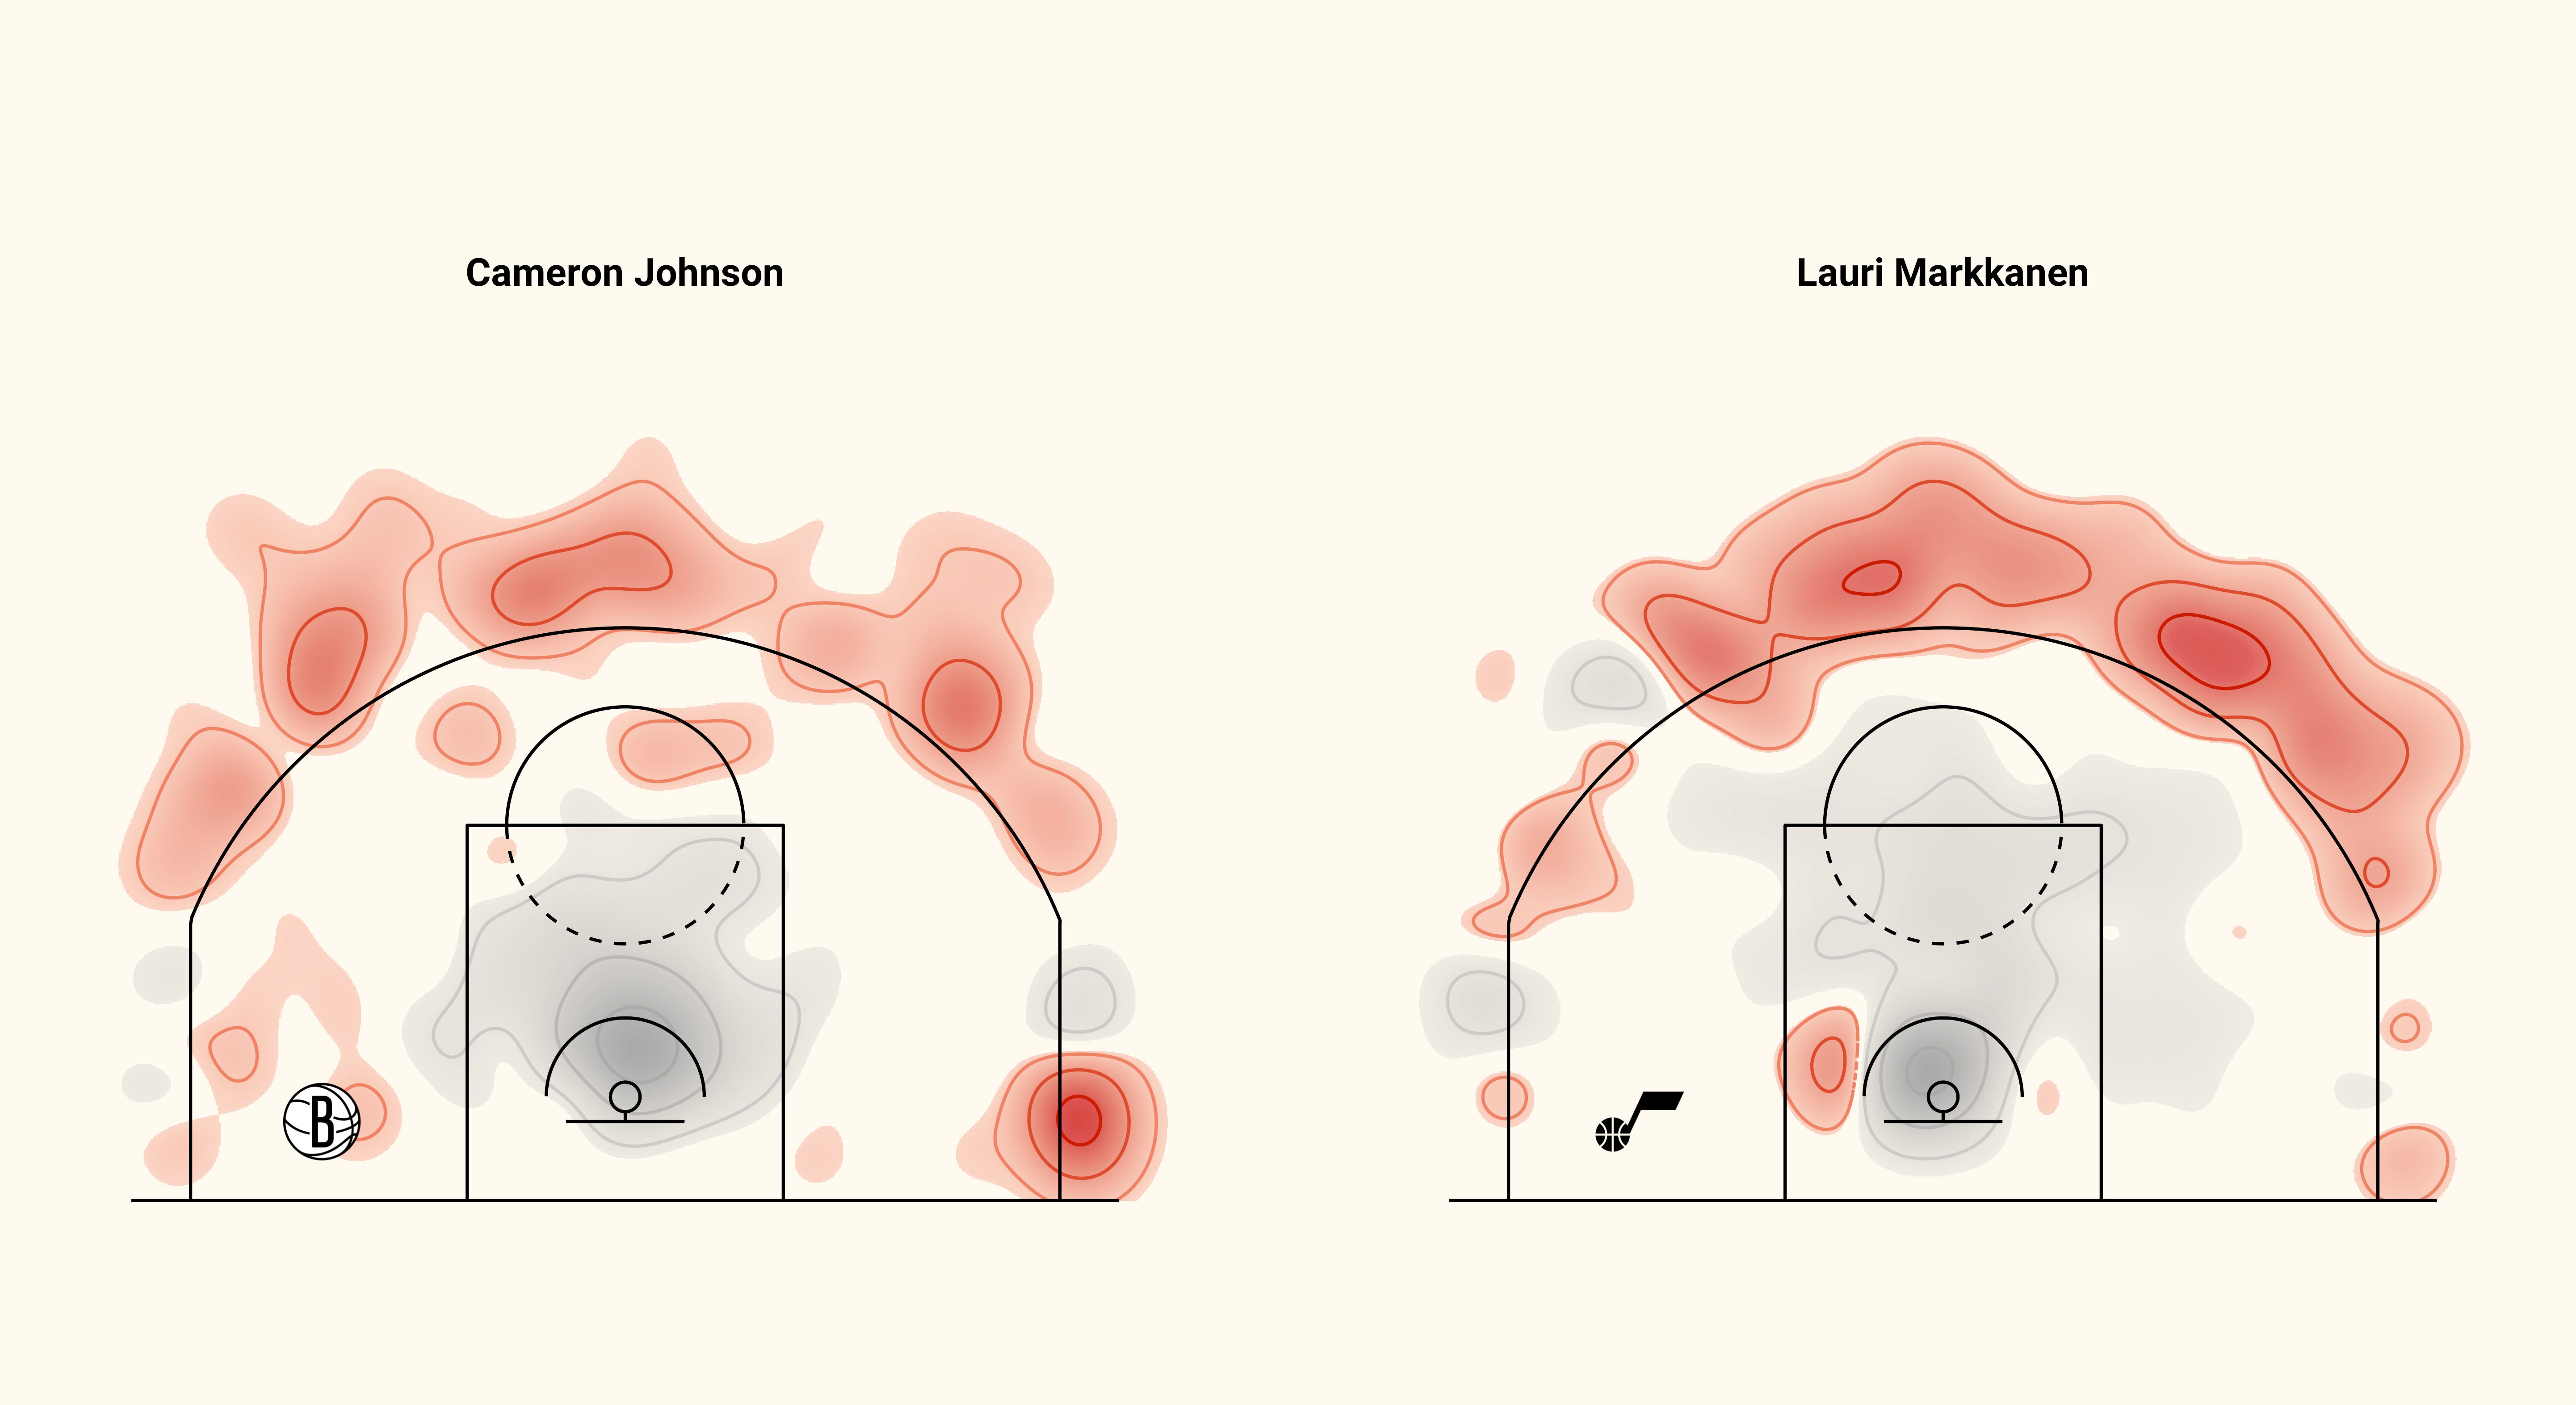
The last thing I want to note is that just about every team’s top scorer has a gray area in the corners. That’s not a coincidence — that’s by design. No one puts star babies in the corner. Star players have the ball in their hands and it’s hard to run an offense through someone standing in the corner. The exceptions on this chart — Lauri Markkanen and Cam Johnson — are good examples of role players that have been asked to cosplay as leading men.
How do I code these graphs in R? or is this Tableau/Power BI?