


How To Make A NBA Jam Style Small Multiple
Plus Who's Hiring

Welcome back to The F5.
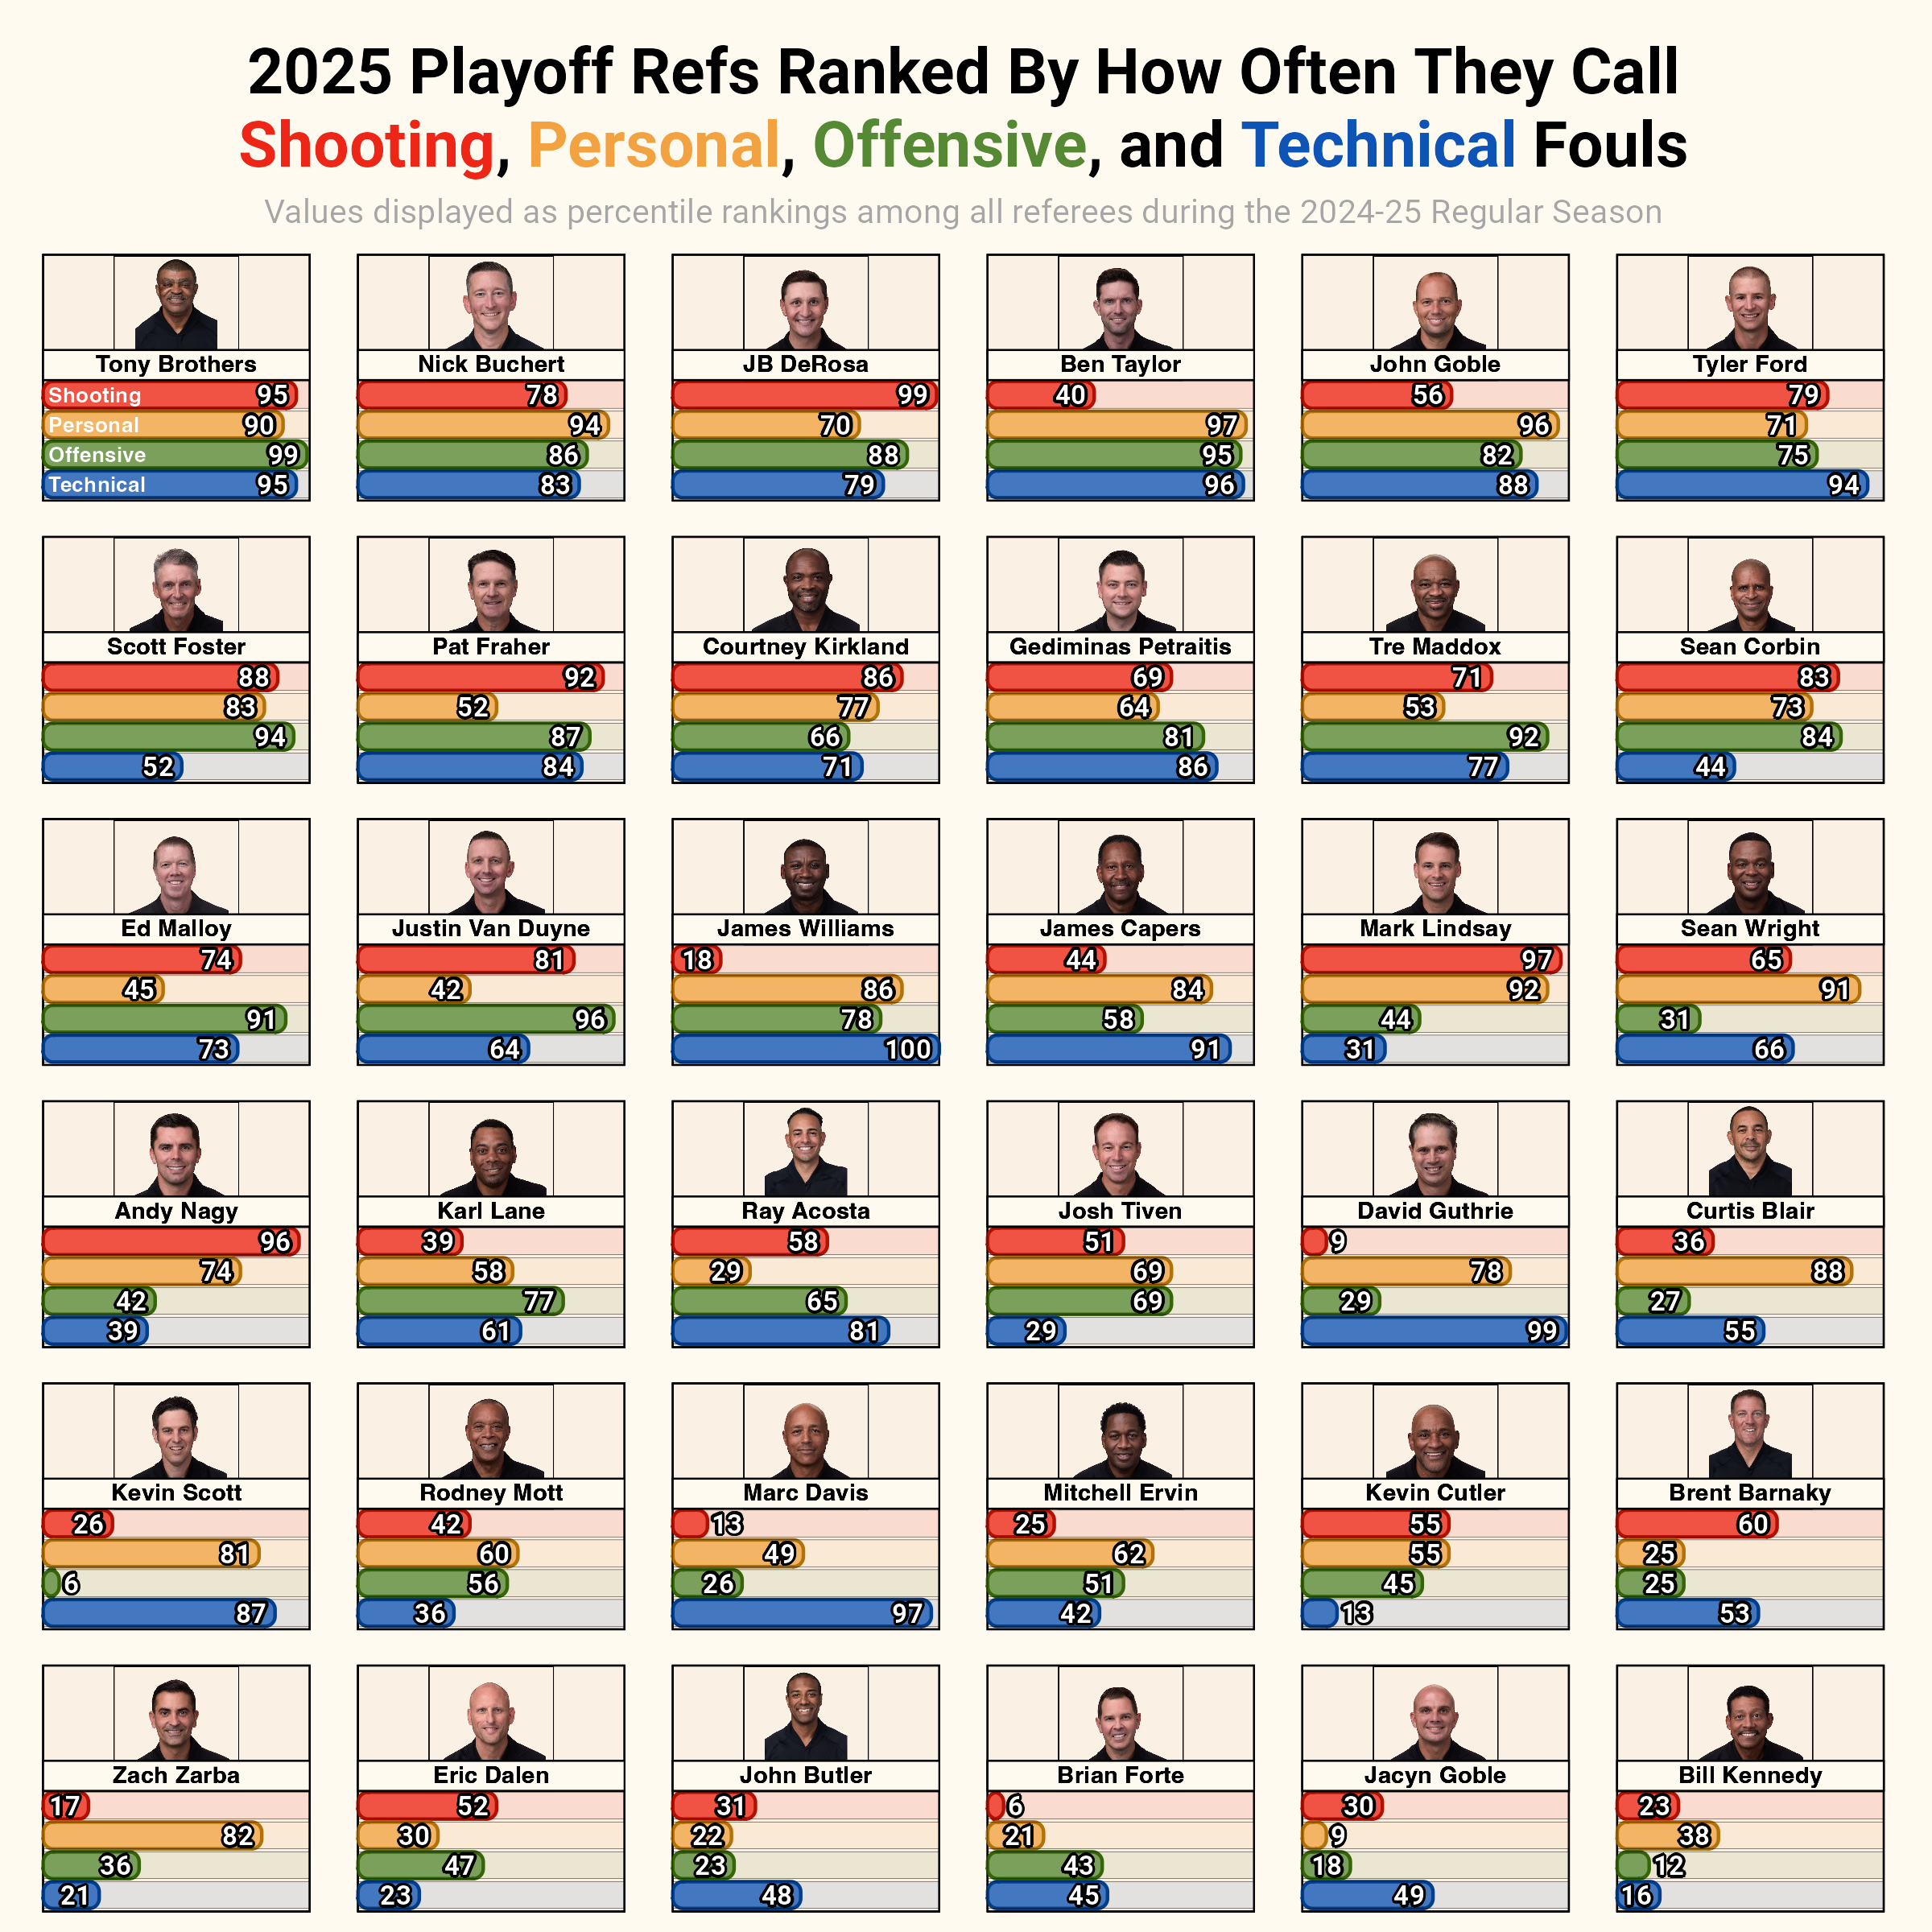
Today, I’ve got a tutorial on how to recreate the following plot. I was going for a NBA Jam aesthetic mixed with a retro VHS cover.
Who’s Hiring
But first, let’s take a look at who’s hiring in the wider sports analytics universe.
🏀 NBA League Office - Machine Learning Engineer (Automated Officiating)
⚾ United Talent Agency / KLUTCH - Senior Analyst, Baseball Operations
🏈 Electronic Arts (EA) - Advanced Analyst (American Football)
⚽ Major League Soccer (MLS) - Director, Business Insights & Analytics
I’m going to make an effort to start sharing these kinds of jobs on a semi-regular basis. To start, I’ll make this at least a monthly feature for paid subscribers. If you’re hiring and want to have a job posting listed on The F5, just reply to this email or send me a DM.
How To
scroll to the end for the full code without commentary
The data for this plot is going to come from my database of NBA referee behavior. But let’s begin by loading some packages and setting a custom theme for our eventual plot.