

Howdy folks,
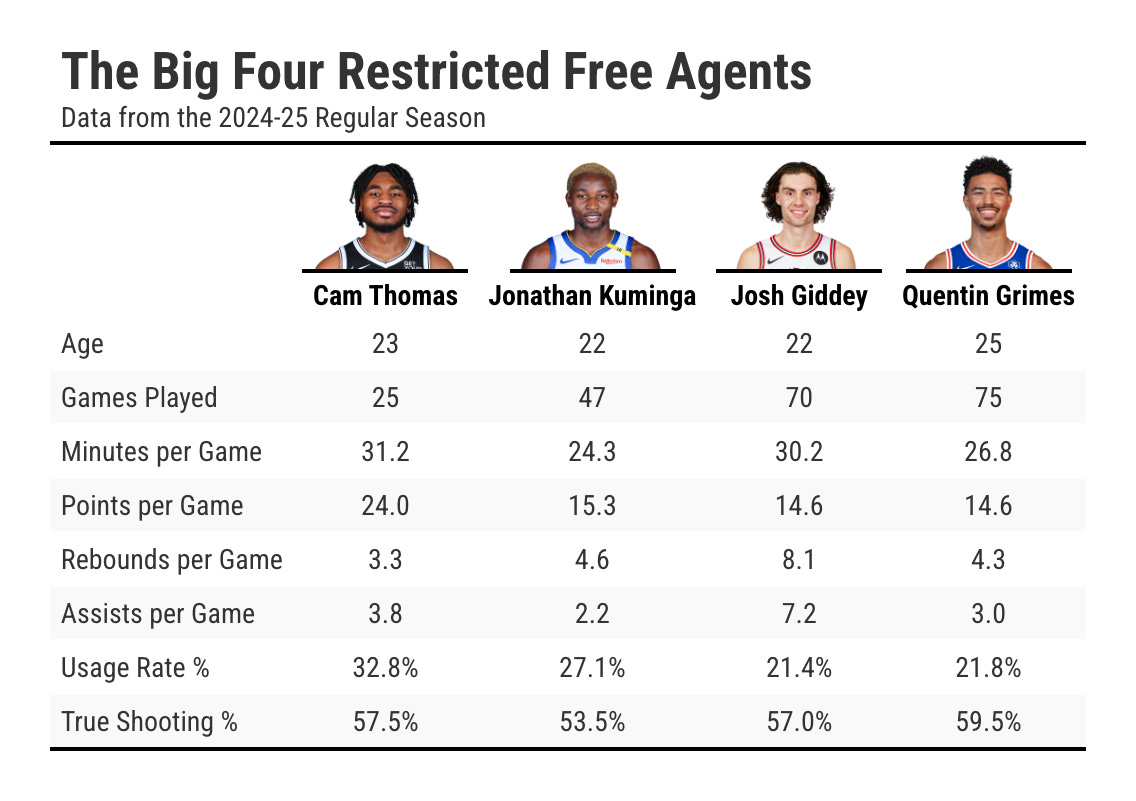
Today’s tutorial is going to show you how I made the following table in both R and Python. Normally, I’d put the player names and headshots in the rows and the statistical categories in the columns. But I switched things up this time and I’ll show you how it works.
We’ll start in R and then move to Python.