R and r/nba
How to download and visualize comment activity from Reddit using R
The Pushshift API makes it stupid simple to access data from Reddit.
For instance, let’s say I’m interested in looking at how daily comment activity on the NBA subreddit has changed since the start of the season.
First, I’m going to load a few packages that I know I’ll need.
library(tidyverse)
library(jsonlite)
library(lubridate)
Next, I need to create a URL from Pushshift that aggregates comment activity at the daily level:
http://api.pushshift.io/reddit/comment/search/?subreddit=nba&aggs=created_utc&frequency=hour&after=2019-10-22
Let me break that down into its individual components.
http://api.pushshift.io/reddit/comment/search/?subreddit=nba
This tell’s me I’m interested in looking at comment activity in the NBA subreddit.
&aggs=created_utc&frequency=hour
This tells me I want to aggregate the total number of comments made at the “created_utc” level, which just means “time”, specifically at the individual “hour” level. You can also aggregate at the “day” level, but I’m going to use “hour” because I want to be able to look at data from the Eastern Time Zone perspective.
&after=2019-10-22
Lastly, this tells me I’m only interested in looking at data after October 22, 2019, the day before the season opener.
If you go and click on that URL, you can actually see the data in your web browser. But let’s view it in R. I’m going to assign that full URL to an object called “url”:
url <- "http://api.pushshift.io/reddit/comment/search/?subreddit=nba&aggs=created_utc&frequency=hour&after=2019-10-22"
Then I’m going to use the fromJSON function from the jsonlite package to read the data from that URL into R
json_data <- fromJSON(paste(readLines(url), collapse=""))
The code above returns the data in a list, but I want it in a dataframe.
df <- as.data.frame(json_data[["aggs"]][["created_utc"]])
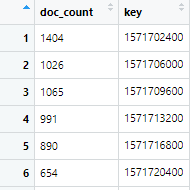
Here’s what that dataframe looks like.

We have “doc_count” which is just the number of comments made. And we have “key” which is our time variable at the hour level in UTC format.
Let’s convert the “key” variable into a more intuitive date time format.
df$created_utc <- as.numeric(as.character(df$key))
df$time <- format(as.POSIXct(df$created_utc, origin = "1970-01-01", tz = 'America/New_York', usetz=TRUE))
df$time <- ymd_hms(df$time)
df$date <- ymd(as.Date(df$time))

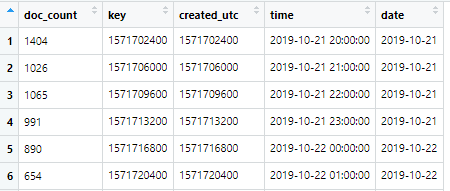
That’s better! Now we have “time” at the hourly level (Eastern Time Zone) and also “date” at the day level.
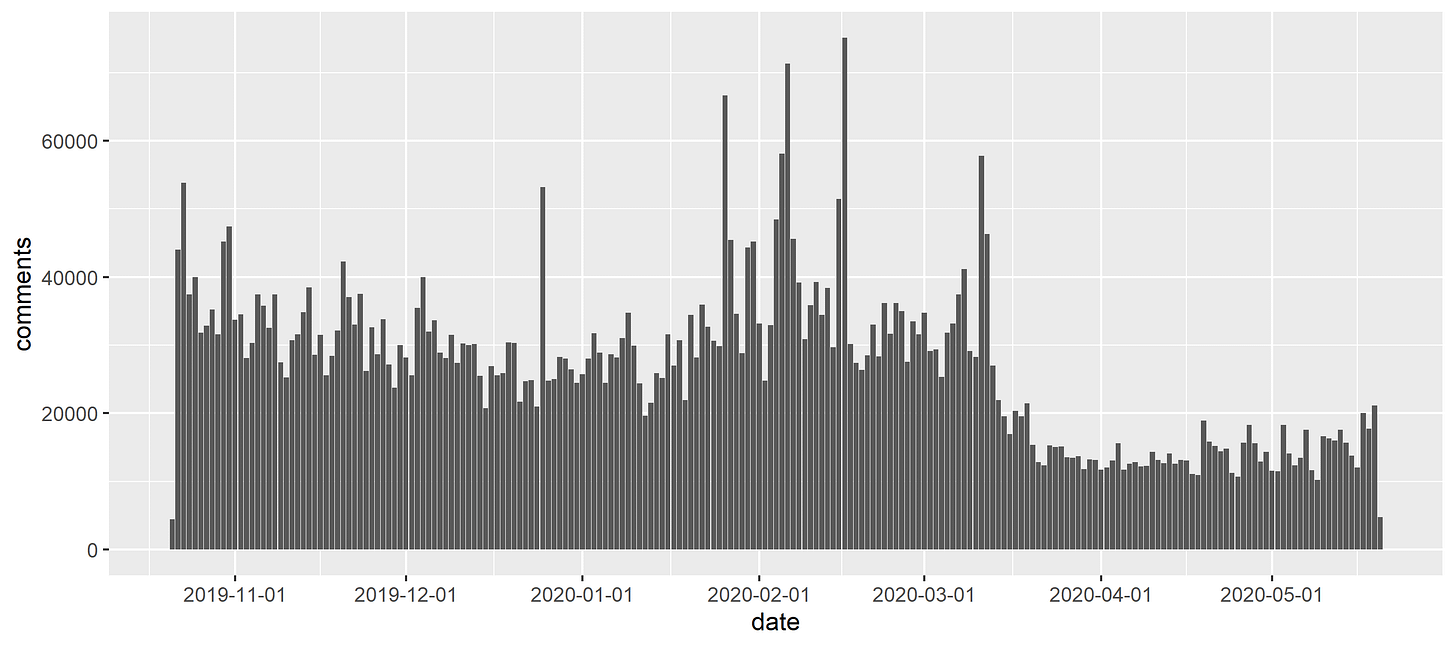
Next, I’m going to summarize the comment activity at the day level and plot it over time using ggplot
df %>%
group_by(date) %>%
summarise(comments = sum(doc_count)) %>%
ggplot(aes(x = date, y = comments)) +
geom_bar(stat = 'identity') +
scale_x_date(breaks = "month")

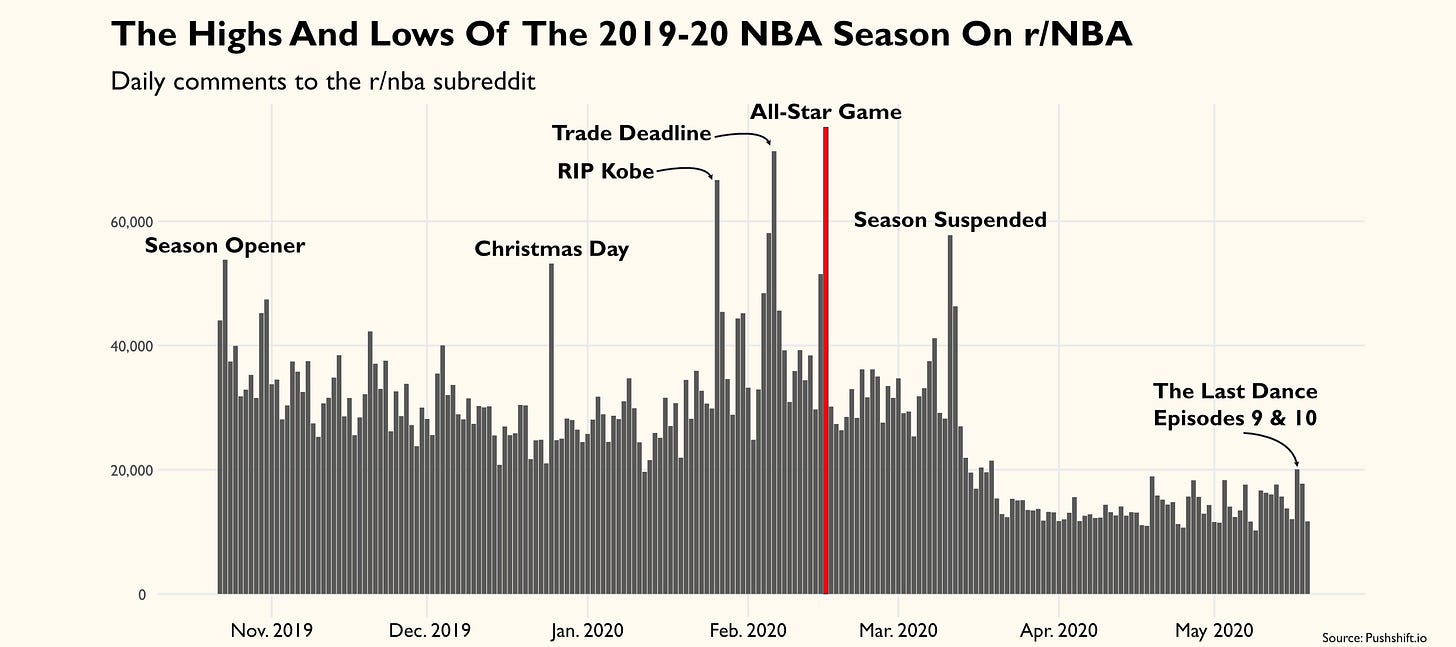
From there we just need to add a few bells and whistles and we’ve got something pretty to look at:


Hello! Thanks for the post, very informative.
I have a problem when following the commands when doing
df <- as.data.frame(json_data[["aggs"]][["created_utc"]])
The dataframe is actually empty, I guess because the deserialization in the step before fails...? Should this still be working as of today?
Are your bells and whistles done completely in R or do you use something else?