I think it’s easy to overlook how a single injury can impact the narrative around a team’s start to the season. Part of this, I think, is because data on games missed is hard to come by. There isn’t a table for it on basketball-reference.com and you can’t find it on any of the pages over at nba.com/stats. That’s the nature of data collection. It’s always easier to count what’s there than it is to count what isn’t.
Fortunately, spotrac.com tracks how often every player has been out for injury, rest, or personal reasons. Additionally, the website details how much money those players have earned while sitting in street clothes. This can help us partially distinguish between teams that have suffered injuries to end-of-the-bench role players versus max-money superstars. Of course, there are players who are impactful and don’t command a high salary (i.e., players on cost-controlled contracts), but it’s helpful context nonetheless.
In the table below you can see each team’s win-loss record as well as the total number of players that have sat out due to injury or other reason. This table helps shine a light on which teams have been bit by the injury bug the hardest to start the year.
I don’t think it’s a coincidence that several of the teams at the top of the table — the ones that have suffered the most from early season absences — have been uninspiring out of the gate. The Los Angeles Clippers, Milwaukee Bucks, and Indiana Pacers are all .500 or below to start the year despite coming into the season with higher expectations. Conversely, several of the teams near the bottom of the table — the ones that have largely been injury free — have been a pleasant surprise.
As the season goes along I expect the relationship between injury and performance relative to expectations to grow even stronger.
Who Is That?
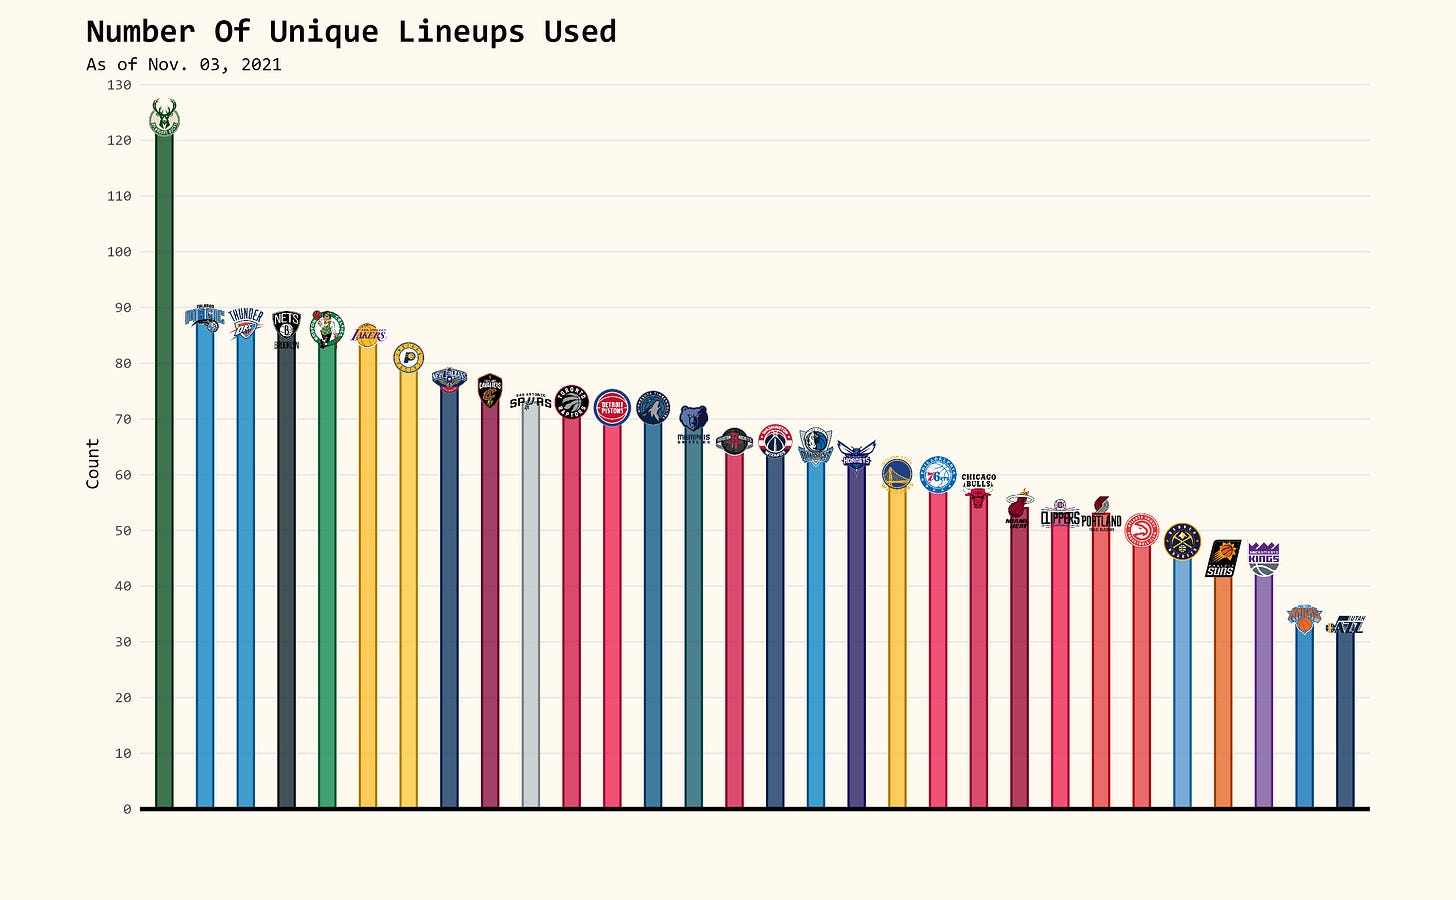
I hinted at this already, but not all injuries are the same. Losing a player in your team’s starting lineup creates more challenges than losing a key bench player. One way to see this is to count the number of unique lineups each team has deployed.
In the chart below you can see that the Milwaukee Bucks have already used more than 120 different lineups to start the year. Even after adjusting for the total number of minutes played for each team, the Bucks are still the league-leader in unique lineups used.
Key injuries to Jrue Holiday, Bobby Portis, and Brook Lopez has forced head coach Mike Budenholzer to roll out some funky five-man units that are normally reserved for garbage time.

Beware Of Early Season On/Off Numbers
A player’s on/off stats can tell us in blunt terms how well a team has performed with that player on the court versus off the court. This is often the first of many steps in determining whether a player is helping or hurting their team. But on/off stats can be deceiving, especially under small sample sizes.
For example, the Denver Nuggets are +16 per 100 possessions when Nikola Jokic is on the court and -23 when he’s off. That’s a massive difference even for a player as great as the reigning MVP.
What’s driving such a big difference? Well, Daryl Blackport of pbpstats.com added a new feature to his site that details how well opponents are shooting from beyond the arc when that player is either on or off the court. It turns out, opponent three-point percentage has a substantial influence on a player’s overall on/off numbers.

For instance, in Denver’s case, opponents are shooting just 28 percent on 3s when Jokic is on the court and 36 percent with him off the court. I know Jokic is a big scary looking guy, but I don’t think he’s personally responsible for teams shooting as poorly as they are when he’s on the court.
On the flip-side is Rudy Gobert. The Utah Jazz actually have a better net rating with Gobert out of the game to start the season. However, teams just happen to be shooting 19 percent from beyond the arc when Gobert is sitting on the bench and 31 percent when he’s on. That’s got nothing to do with Gobert. That’s just luck.
Open For A Reason
Every year it’s a challenge to tell whether a hot shooting start is for real or just a blip on the radar. There are clever ways to estimate a player’s actual shooting ability when dealing with small samples, but one simple way to tell if you should take a player’s shooting seriously is to look at how they’re being defended along the perimeter. Defenses are pretty good at quickly sniffing out which players are legitimate shooting threats versus guys that still need to prove it.
The table below shows the top 45 players in three-point attempts so far this season and the percentage of those 3s that have been contested (i.e., defender within six feet). The further up the table a player is, the less willing defenses are to leave them open.
Of course, there are other factors that influence how often a player takes contested 3s (whether they take shots predominantly off the dribble or are strictly involved in catch-and-shoot opportunities), but by and large I believe that a player’s reputation as a shooter is more stable than their actual production as one.


