
Another Comeback
Plus, a MVP waffle plot tutorial

Last night, the Indiana Pacers trailed the New York Knicks 102-116 with 3:44 remaining in regulation of Game 1 of the Eastern Conference Finals. Someone probably fell asleep on their couch thinking the game was over.
It was not.
The Pacers defeated the Knicks in overtime, successfully pulling off the fourth most improbable playoff comeback of the play-by-play era, according to Mike Beuoy of inpredictable.com.

Last night’s game was just the latest in a string of a last minute turnarounds we’ve seen this season. Indiana’s comeback was the 14th time this season (regular season and playoffs combined) that a team has won after trailing by double digits with less than five minutes remaining. The last team to accomplish this was the Denver Nuggets in Game 1 against the Oklahoma City Thunder. The Nuggets trailed 102-113 with 4:30 remaining before storming back and winning the game on an Aaron Gordon three in regulation.

I think what was special about Indiana’s comeback was that it was driven almost entirely by special shotmaking as opposed to mistakes by the team that was in the lead. In other words, I don’t think the Knicks committed an egregious choke job. Sure, they can look back and regret missing free throws or fouling up three with 13 seconds1, but the story of the game belongs to Aaron Nesmith and how he made six out of his seven three-pointers in the fourth quarter, which gave Tyrese Haliburton the chance to take and make this shot.
As a team, Indiana is shooting 40.6 percent from beyond the arc in the playoffs. That would rank as the 40th best three-point shooting performance by a team in playoff history. However, that includes plenty of teams that barely took any threes during their postseason run. So if we add a minimum threshold of 200 three-point attempts, Indiana jumps up to 9th all-time.

Haters will call it luck and say the Pacers are bound to regress in the long run. But the Pacers don’t need the long run. They just need seven more wins.
How To Make A Waffle Plot
I’m going to share the code for recreating the following chart in R. This is the kind of content that paid subscribers receive every week so if you find it valuable, consider a subscription to the The F5 for the low cost of a beer at happy hour.
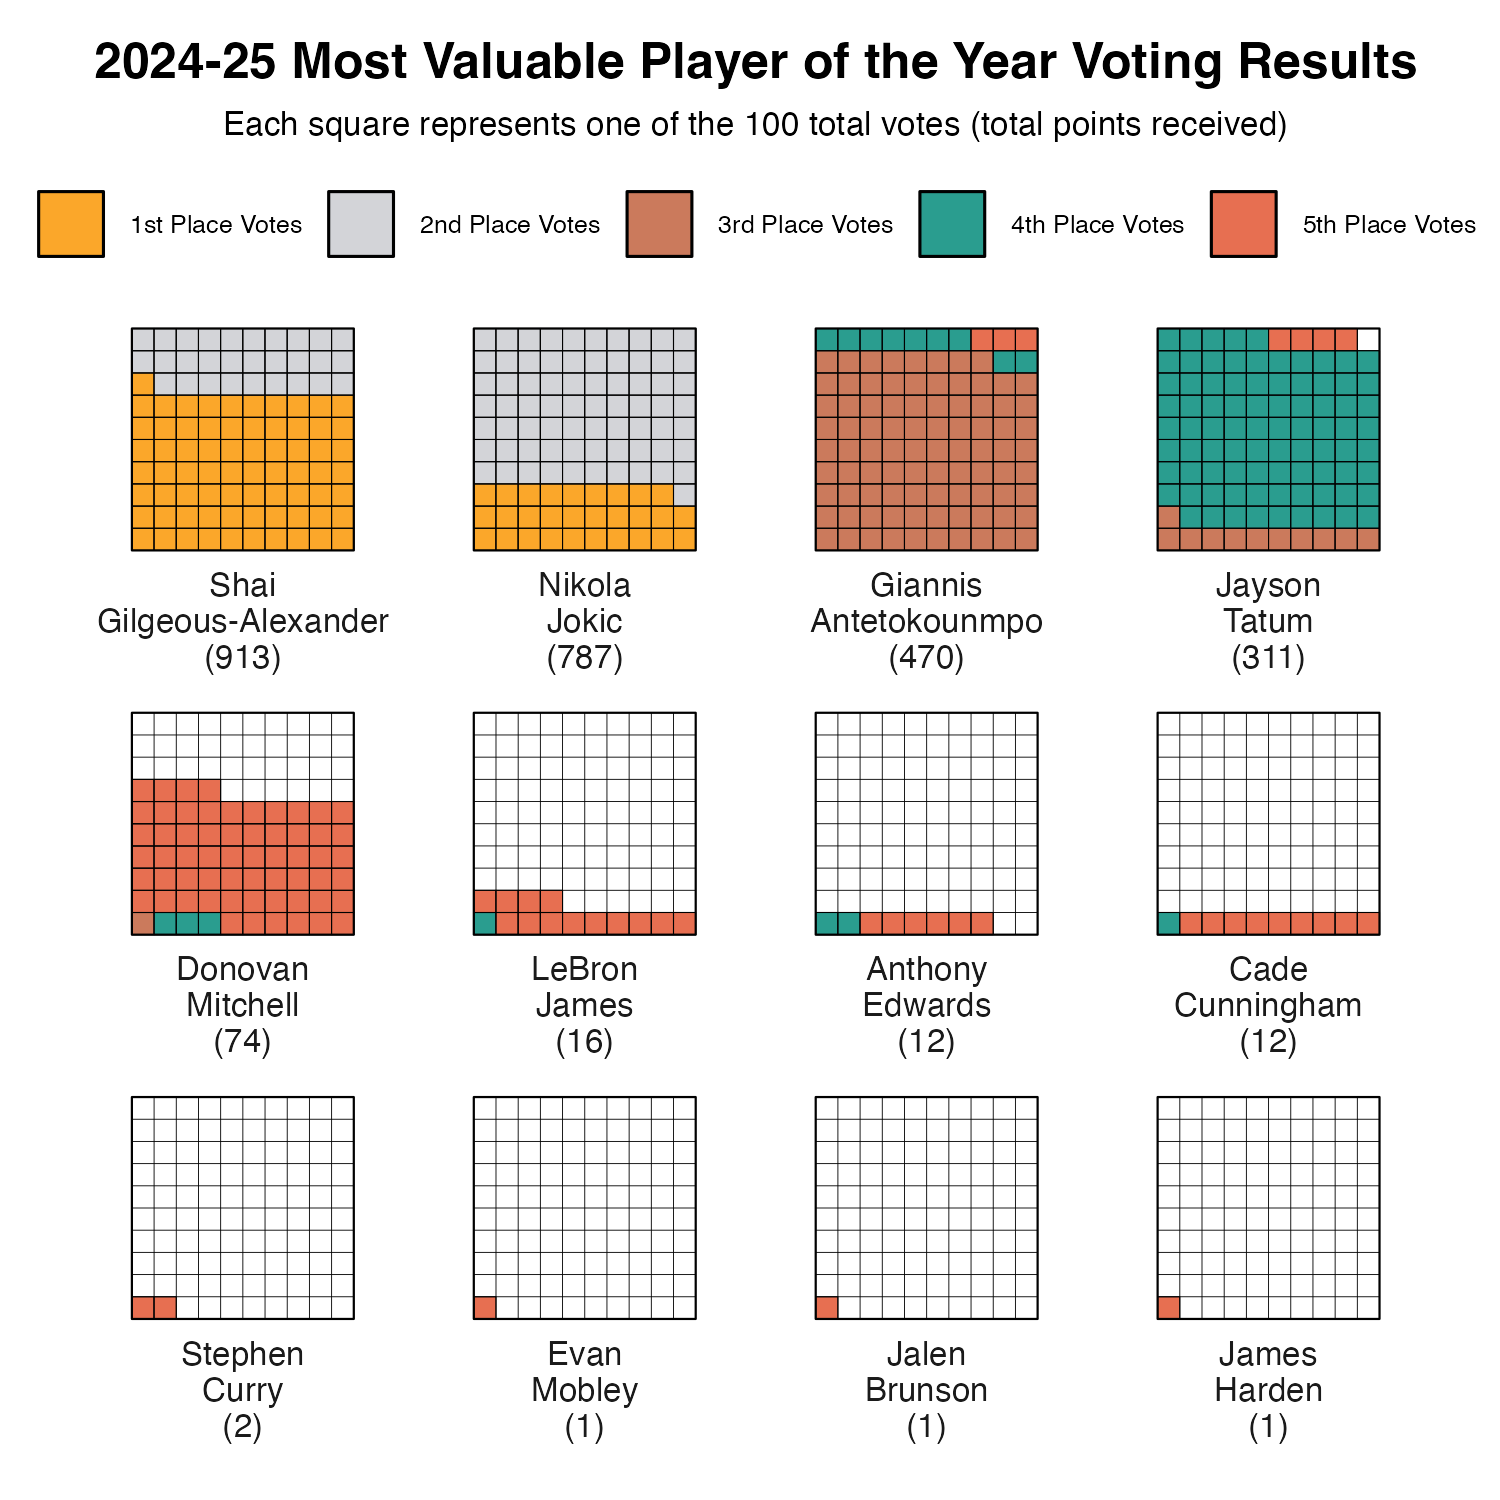
This chart type is called a waffle plot. It’s like a better version of a pie chart and it’s especially useful when you have exactly 100 of something…like we do with MVP votes.
The data for out chart is going to come from the MVP voting results, found here.
So let’s load our packages and set up our data
# if you dont have the tidyverse or waffle package installed...
# youll first need to run:
# install.packages("tidyverse")
# install.packages("waffle")
# load libraries
library(tidyverse) # for data wrangling
library(waffle) # for waffle plot
# add data for our plot
df <- data.frame(
player = c("Shai Gilgeous-Alexander",
"Nikola Jokic",
"Giannis Antetokounmpo",
"Jayson Tatum",
"Donovan Mitchell",
"LeBron James",
"Cade Cunningham",
"Anthony Edwards",
"Stephen Curry",
"Jalen Brunson",
"James Harden",
"Evan Mobley"),
x1st = c(71, 29, 0, 0, 0, 0, 0, 0, 0, 0, 0, 0),
x2nd = c(29, 71, 0, 0, 0, 0, 0, 0, 0, 0, 0, 0),
x3rd = c(0, 0, 88, 11, 1, 0, 0, 0, 0, 0, 0, 0),
x4th = c(0, 0, 9, 84, 3, 1, 1, 2, 0, 0, 0, 0),
x5th = c(0, 0, 3, 4, 60, 13, 9, 6, 2, 1, 1, 1),
total_points = c(913, 787, 470, 311, 74, 16, 12, 12, 2, 1, 1, 1)
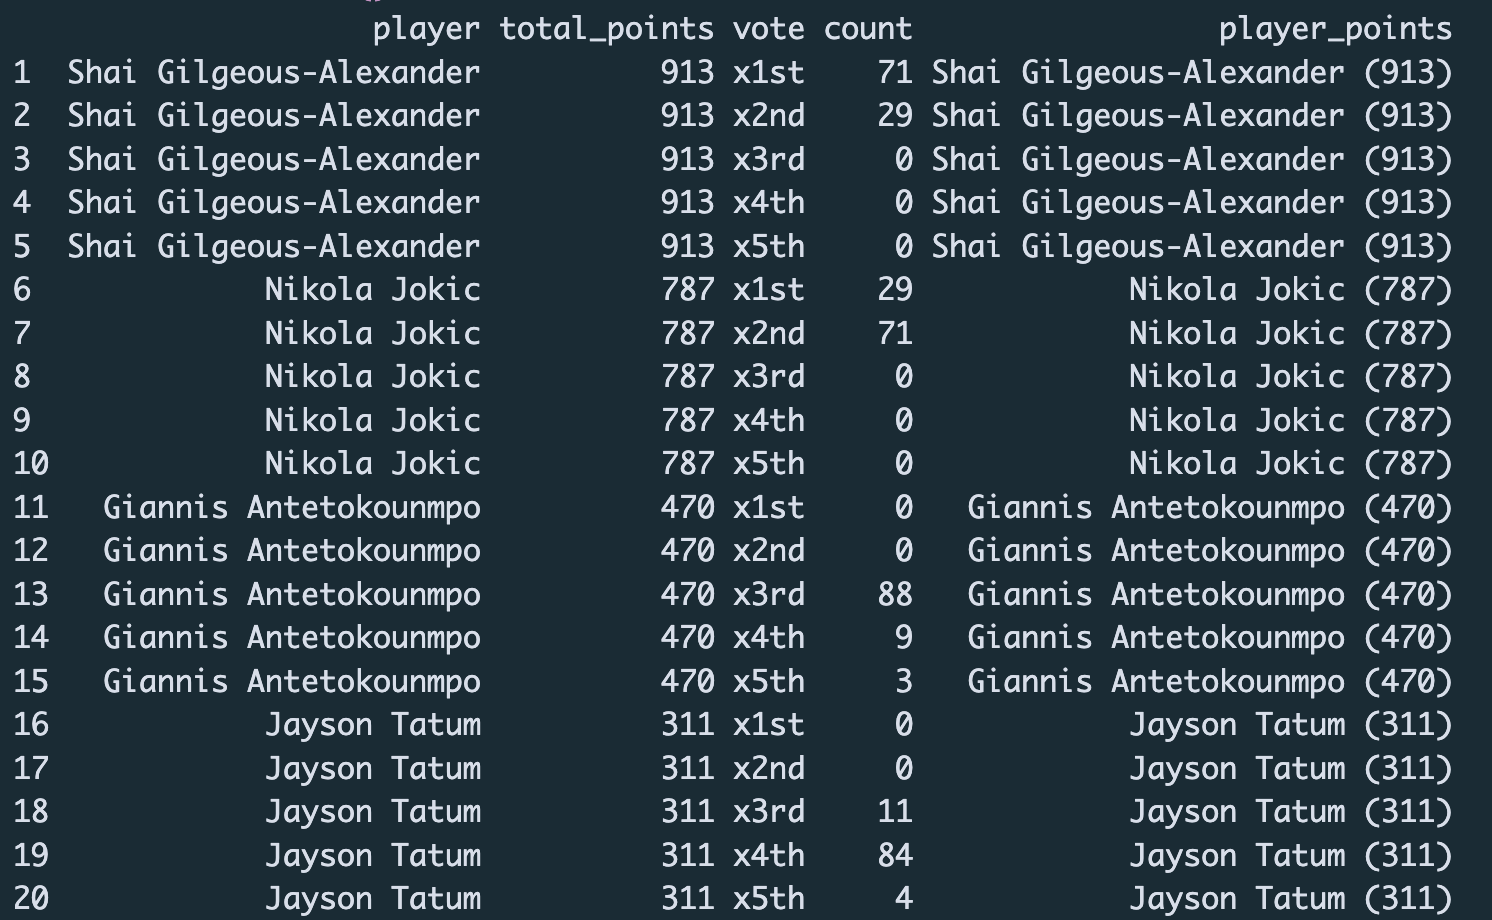
) This is what our data looks like.

We need our data in a “long” format for our plot. So let’s use the pivot_longer function to transform our dataframe.
# pivot data long and create a variable called player_points
df <- df %>%
  pivot_longer(-c(player, total_points), names_to = "vote", values_to = "count") %>%
  mutate(player_points = paste0(player, " (", total_points, ")"))
Now our dataframe should look like this…much longer.
Now we can make and save our waffle plot.
df %>%
  ggplot() +
  # color by vote, divide the waffle by count
  geom_waffle(aes(fill = vote, values = count),
              color = "black",
              linewidth = .1,
              n_rows = 10,
              flip = T) +
  # sort players by their total points received
  facet_wrap(~fct_reorder(player_points, -total_points),
             nrow = 3,
             strip.position = "bottom",
             labeller = label_wrap_gen(5)) +
  # set coord to equal so that we have a perfect square
  coord_equal(clip = 'off') +
  # format x and y axis
  scale_x_discrete(expand = c(0,0)) +
  scale_y_continuous(expand = c(0,0)) +
  # add intersecting lines throuhgout the waffle
  geom_vline(xintercept = seq(1.5, 9.5, 1),
             color = 'black',
             size = .1) +
  geom_hline(yintercept = seq(1.5, 9.5, 1),
             color = 'black',
             size = .1) +
  # add color
  scale_fill_manual(values = c("#FBA72AFF",
                               "#D3D4D8FF",
                               "#CB7A5CFF",
                               "#2a9d8f",
                               "#e76f51"),
                    labels = c("1st Place Votes",
                               "2nd Place Votes",
                               "3rd Place Votes",
                               "4th Place Votes",
                               "5th Place Votes")) +
  # set theme
  theme_minimal()  +
  # make some theme tweaks
  theme(legend.position = 'top', # put the legend up top
        legend.title = element_blank(), # remove legend title
        legend.text = element_text(size = 6), # adjust legend text size
        strip.text.x = element_text(size = 8), # adjust strip text size
        axis.title.y=element_blank(), # remove yaxis title
        axis.text.y=element_blank(), # remove yaxis text
        axis.ticks.y=element_blank(), # remove yaxis ticks
        panel.grid = element_blank(), # remove panel grid
        panel.border = element_rect(colour = "black",
                                    fill=NA,
                                    size = .25),
        panel.spacing.x = unit(2, 'lines'), # adjust space b/w facets
        plot.title = element_text(face = 'bold', # adjust plot title
                                  size = 12,
                                  hjust = .5),
        plot.subtitle = element_text(size = 8,
                                     hjust = .5), # adjust plot subtitle
        plot.margin= margin(10, 10, 10, 10) # adjust plot margins
        ) +
  # add title, and susbtilte
  labs(title = "2024-25 Most Valuable Player of the Year Voting Results",
       subtitle = "Each square represents one of the 100 total votes (total points received)")

ggsave("mvp_waffle_plot.png",
       width = 5,
       height = 5,
       dpi = 300,
       bg = 'white')
I’m not convinced that fouling up three is the obvious “right” decision. It’s true that teams that foul up three win more often than teams that don’t. But we’re talking about just a few percentage points on top of an already high base rate. In other words, the teams that are up three are highly likely to win no matter what they do. Further, the pro-foul up three argument assumes the leading team can execute the strategy correctly. That typically means fouling with less than ten seconds to go and ideally when the trailing team has no timeouts remaining to advance the ball. But executing it perfectly again and again requires devoting practice time to something that is unlikely to actually matter. So, in conclusion, maybe just play basketball.
I am shocked to see that the Cleveland teams of the last decade thrived because of 3 point shooting. I don't remember anyone commenting on that at the time. I am sure that is just ignorance on my part, but I saw every postseason game those years.
the last line of the footnote is an evergreen take. I totally agree, but I also feel like the Knicks defense *did* kind of slip toward the end of the (regulation) game.