Stepping back from it all
the f5 is shooting 78 percent on one handed written posts the night before
Six years ago, when the NBA recorded 584 step back three-pointers, Seth Partnow wrote a prescient article about the dangers of citing shooting percentages derived from play-by-play logs. This season, the NBA recorded 4,933 step back three-pointers and the larger basketball-watching world is no better at exercising caution when citing these percentages.

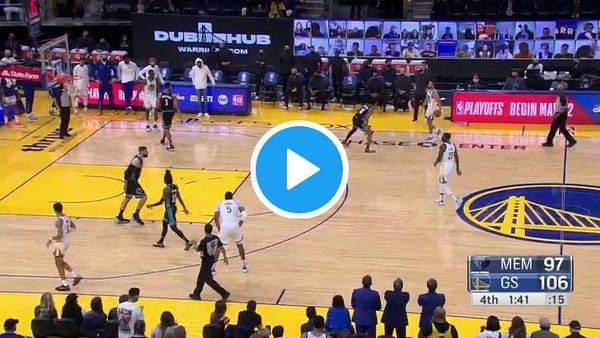
If you weren’t already aware, every shot in the NBA is classified as some version of a jump shot (catch and shoot), pullup jump shot (off the dribble), or increasingly, a step back jump shot in the moment by human scorekeepers. Whenever Steph Curry breaks down his man, steps back, and launches a shot from 28 feet, it’s an error-prone human that determines the type of shot Curry took.
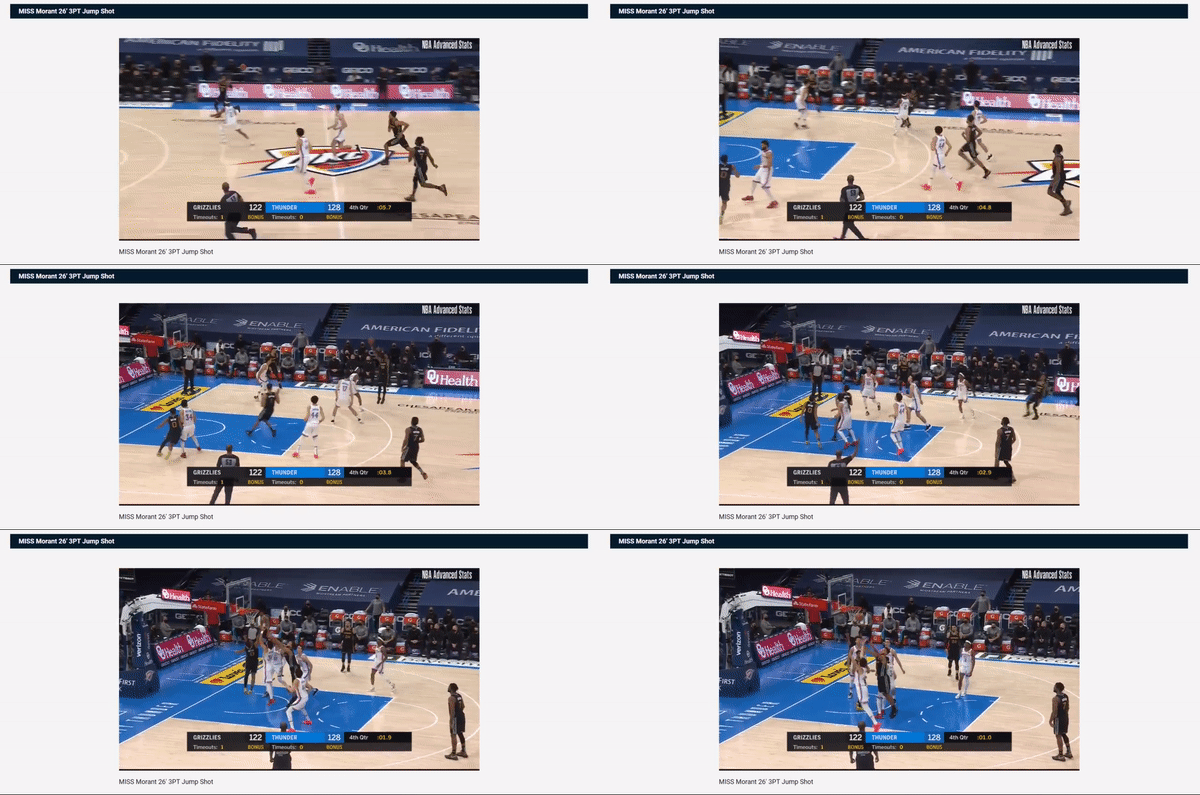
Occasionally, due to the challenges of determining a player’s movement in the moment, the scorekeeper will misclassify a shot. For instance, the following shot by Luka Doncic was recorded as a missed 29-foot jump shot even though Doncic clearly creates space between himself and the defender by deploying his signature step back.
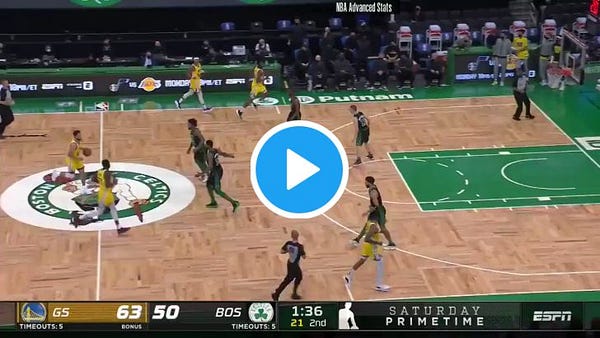
There’s no difference between the above shot and the following shot, which was correctly recorded as a step back.
This all means that some shooting percentages, like the ones cited in the tweet at the beginning of this post, aren’t accurate. The only way to find out a player’s actual shooting percentage on step backs would be to look it up on a prohibitively expensive Second Spectrum account, which uses camera tracking and machine learning algorithms to determine shot types. Or you could watch every shot a player took and manually classify them yourself.
Since I write a free newsletter and have a high tolerance for boredom, I opted for the latter of those two choices.
Over the last couple of days, I watched and hand tracked all 801 three point attempts by Curry, the league leader in 3s this season, and all 548 three point attempts by Doncic, the league leader in step back 3s this season.
To keep things simple, I classified all attempts into jump shots, pullups, or step backs. The fancier versions of each were usually classified as the base version (i.e., most running pullup jump shots were just pullup jump shots in my book).
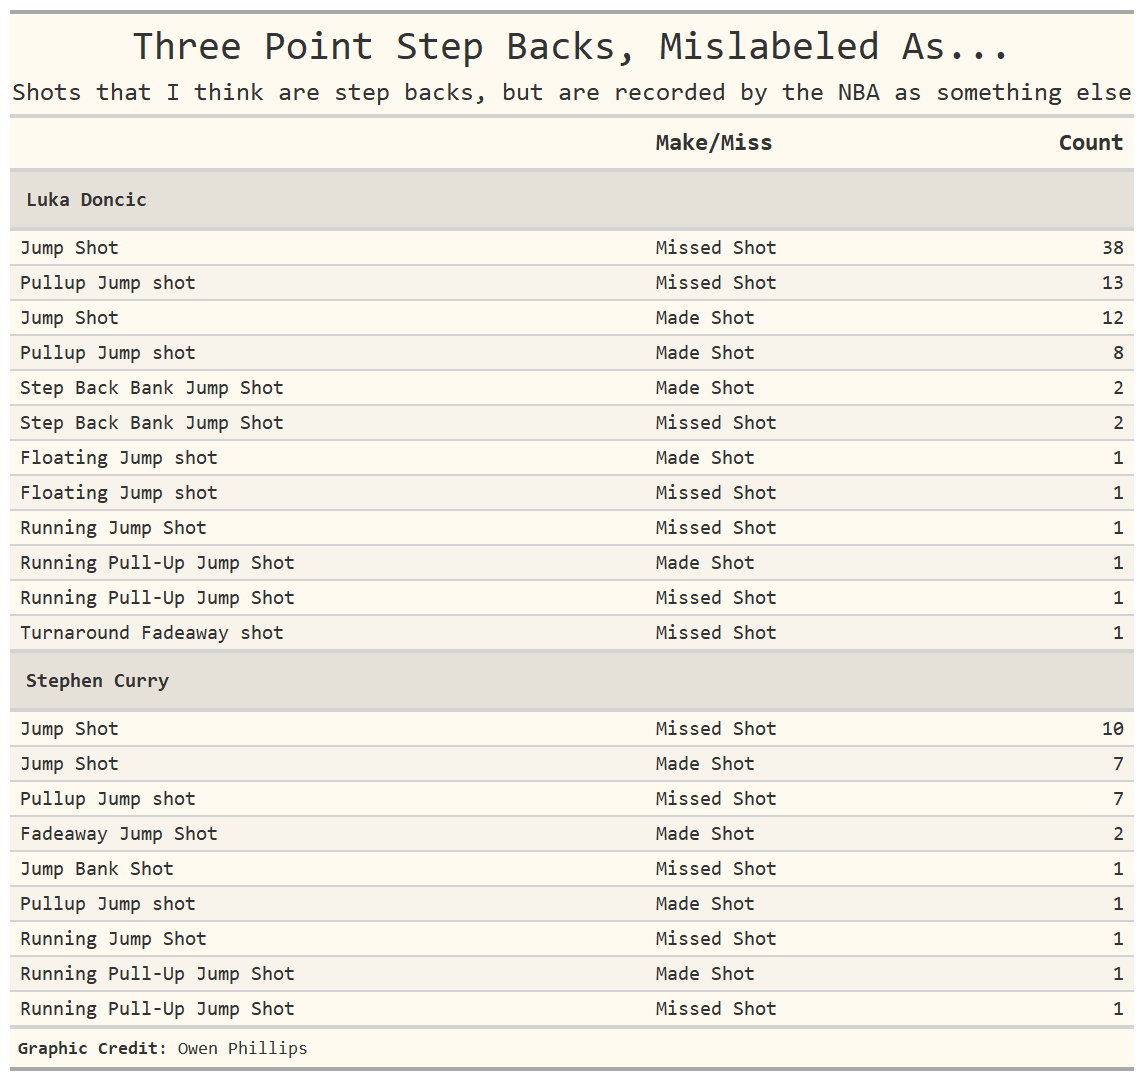
Here’s what I found and how it compares to the NBA’s tracking:
According to NBA play-by-play logs, Curry attempted 124 step back 3s this season. Meanwhile, Doncic attempted 258. But by my hand count, Curry actually attempted 148 while Doncic took a whopping 336 on the season.
This wouldn’t be too much of a problem if shot type misclassifications happened at random. The reason it’s a problem is because missed shots are the ones that are disproportionally misclassified. In other words, shots that I personally tracked as missed step backs are often getting recorded as missed jump shots. This results in inflated shooting percentages for shots like step backs and deflated shooting percentages for standard jump shots.
If you look at the NBA’s numbers in the first table, Curry shot 48.4 percent on step back 3s this season while Doncic shot 35.7 percent. But when you include the shot attempts that I deemed to be step backs - and likely should have been recorded as such - those numbers fall to 44.6 percent and 33.9 percent, respectively.
The reason missed shots are disproportionally misclassified has to do with the fact scorekeepers are tasked with keeping up with the action on the court while also maintaining an official play-by-play record. Here’s what Partnow wrote six years ago about this problem:
…a shot, a miss, a rebound and a possession starting the other way is a lot to keep track of, whereas the pause for breath after a made bucket gives the scorekeeper a little time to add a little flavor to the official record. The end result is “fancier” plays end up looking more effective than they actually are if one went strictly off the PBP feed.
I don’t think this is a huge deal for high volume step back three point shooters. A couple of percentage points off is worth a disclaimer, but it isn’t the end of the world. The real problem with these numbers pertains to the other 98 percent of NBA players who might only take a few dozen step backs at most. Small and biased samples are the quickest way to arrive at the wrong conclusions.
For example, Ja Morant is an objectively poor three point shooter, but he apparently made 43.3 percent of his step back 3s during the regular season (I’m combining his step back jump shots as well his step back bank jump shots). Knowing that, you’d think the cure to Morant’s shooting woes would be for him to just take a step back! But after watching all 241 of Morant’s three point attempts this season, I found that he actually shot just 36.1 percent on step back 3s. A decrease of seven percentage points from the official record.
I’d wager the NBA realizes how unreliable this shot type data is because they don’t have a page on their site that ranks players by their step back efficiency. You have to go to a player’s individual page to find those numbers. But given how often these numbers are cited and unintentionally misused by smart writers and analysts (I’m including myself) it might be worth it for the NBA to rethink how they present this data.
In a perfect world, the NBA would have someone go back watch every shot attempt the next day and update any incorrect classifications. That’s probably too much to ask for, so until we can all afford Second Spectrum accounts (someone should gift me one, just saying), I would recommend a heavy dose of skepticism when you see numbers like the following in the wild:

Stepping Up
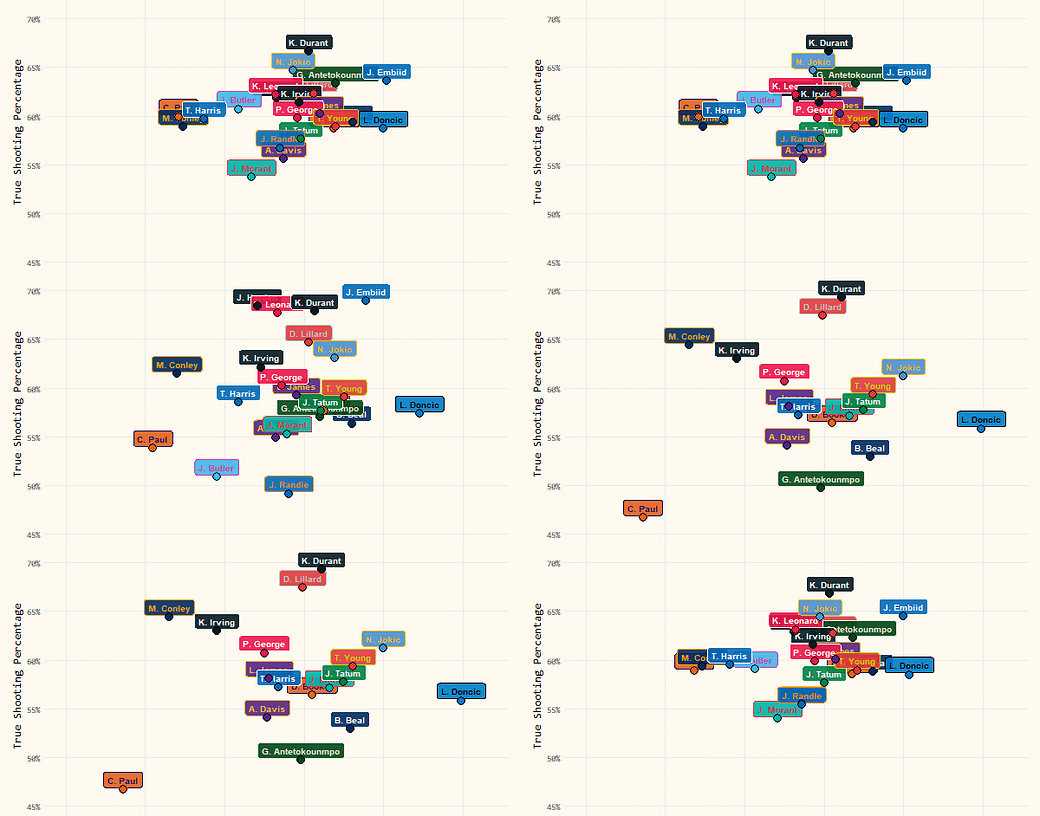
Here’s an animated chart showing the change in players’ usage and scoring efficiency during this year’s playoffs relative to the regular season. If you don’t like the animated version, I made a static version1 that I’ll drop in the footnotes.
This chart really puts into context how Jimmy Butler and Julius Randle shit the bed. In Dallas, Doncic is reaching 2017-Russell-Westbrook levels of usage and his scoring efficiency is paying the price. Chris Paul is playing through injuries and doesn’t look like himself. Also, Kawhi Leonard continues to be one of the few superstars who can seemingly flip a switch and level up in the playoffs.
I’ll post updated versions of this chart throughout the playoffs to see which guys are stepping up or stepping back.
Rich Paul Gets The Chotiner Treatment
Earlier this week, The New Yorker’s Isaac Chotiner published a profile of Rich Paul, LeBron James’s agent and founder of Klutch Sports. The whole piece is worth reading, but I was struck by Paul’s comments on players’ — specifically, white American players — unwillingness to be represented by an agent of a different race.
At the same time, Paul said, “It’s very difficult for me to represent a white player.” I expressed surprise that this was the case.
“It just is. Look around. There’s very few,” he said. “I represent a player from Bosnia. But, again, he’s international. He looks at it different.”
“So white players who are American don’t want a Black agent?” I asked him.
“They’ll never say that,” Paul answered, cracking a rare smile. “But they don’t. I think there’s always going to be that cloud over America.”
I was curious how many white Americans are represented by Black agents. Hoopshype.com has a directory of NBA agents so I went through and identified the race of every agent that represents one of the 39 white American players in the NBA. I defined “American” as any player that was born in the USA, according to the NBA. That means Domantas Sabonis and Isaiah Hartenstein are included here even though I don’t think either player identifies exclusively as an American.
From what I can tell, Frank Kaminsky and Luke Kornet are the only white Americans with Black agents. Kaminsky is represented by Bill Duffy of BDA Sports Management while Kornet is represented by both Jim Tanner (who is Black) and Matt Laczkowski (who is white) of Tandem Sports and Entertainment. The other 37 white American players in the NBA are all represented by white agents.
I think this basically confirms what Paul suspects. When given a choice, most players would rather be represented by someone that looks like them. The problem is that there are so few agents that look like most of the players in today’s NBA. They can’t all be Klutch clients. As a result, most players, regardless of race, are represented by white agents. In that sense, Paul’s role as one of the few prominent Black agents is noteworthy.
It appears that Paul’s other comment about international players looking at this dynamic differently checks out as well. Paul represents Jusuf Nurkic. Meanwhile, Duffy represents Luka Doncic, Nikola Vucevic, and Goran Dragic.
Full disclosure: since I collected this data manually, there’s a chance that I made a mistake somewhere. I may have omitted a white American player from my sample or misidentified the race of one of the agents. So I’m attaching the data I worked with below in the footnotes2. If you see a mistake, let me know and I’ll update this post accordingly.





"In Dallas, Doncic is reaching 2017-Russell-Westbrook levels of usage and his scoring efficiency is paying the price."
The only reason his TS is down from regular season is he is shooting 43% from FT line (0-5 game 4). His efg is actually up, .550 ->.563. Unless your saying his free throw is related to his high usage.
Nice stuff, but I have my doubts about the accuracy of Second Spectrum's data as well. I've seen plenty of writers (like LGW) use play-type data in analyzing what a player is good at without ever seeing anyone analyze how good Second Spectrum's data quality really is for that sort of analysis—especially when it comes to classifying a particular player's contribution as a "screen assist" or "P&R roll man" we're often dealing with low sample sizes that are susceptible to noise. Cameras and machine learning can do some impressive things, but they screw up too; for all I know, they might screw up more than the human scorers do. Heck, 583's metrics use tracking data to analyze players' defense—specifically, (if I remember correctly) it rewards or punishes the "nearest defender" based on shooting percentages vs. league average. Which, I have some issues with on its own¹, but I don't think anyone has publicly shared stats on how accurate Second Spectrum even is at fundamental stuff like correctly labeling the nearest defender, let alone slippery definitions like shot type and play type.
¹ Specifically, 538's approach to rating defense this way lets guys off the hook for getting blown by or losing track of their assignment completely. They at least try not to punish the teammate who rotates to attempt a difficult contest, by giving guys credit for defending more shots. (They acknowledged this shortcoming in the introduction to the "DRAYMOND" metric, but as far as I know there haven't been any follow-ups to analyze how much this skews the numbers.) Also, even Second Spectrum doesn't seem to give out any stats (or at least, 538 isn't using them) when a guy defends so well that the offensive player does not even attempt a shot; as far as I can tell, their metric probably actually punishes this a little because it rewards people for defending more shots. But I digress.
Anyway, it's great that there are people like you taking a skeptical eye to the statistics and identifying systematic bias in the way they're calculated. It's easy to talk up data-driven decisions and opinions, but those can be a lot more accurate when you know the caveats and limitations of the data you're using.