The All-NBA Impact Team
Plus, every team's favorite spot
I don’t have much to contribute to the end of year awards discussion because I don’t have a vote and no one cares what I think. But I do have a lot of data pulled together from different sources that some of you might be interested in.
Back in February, I linked together a bunch of different popular all-in-one impact metrics to make it easier to compare batches of players against one another. They aren’t the end-all-be-all, but these metrics are nice to have when they’re all in one place.
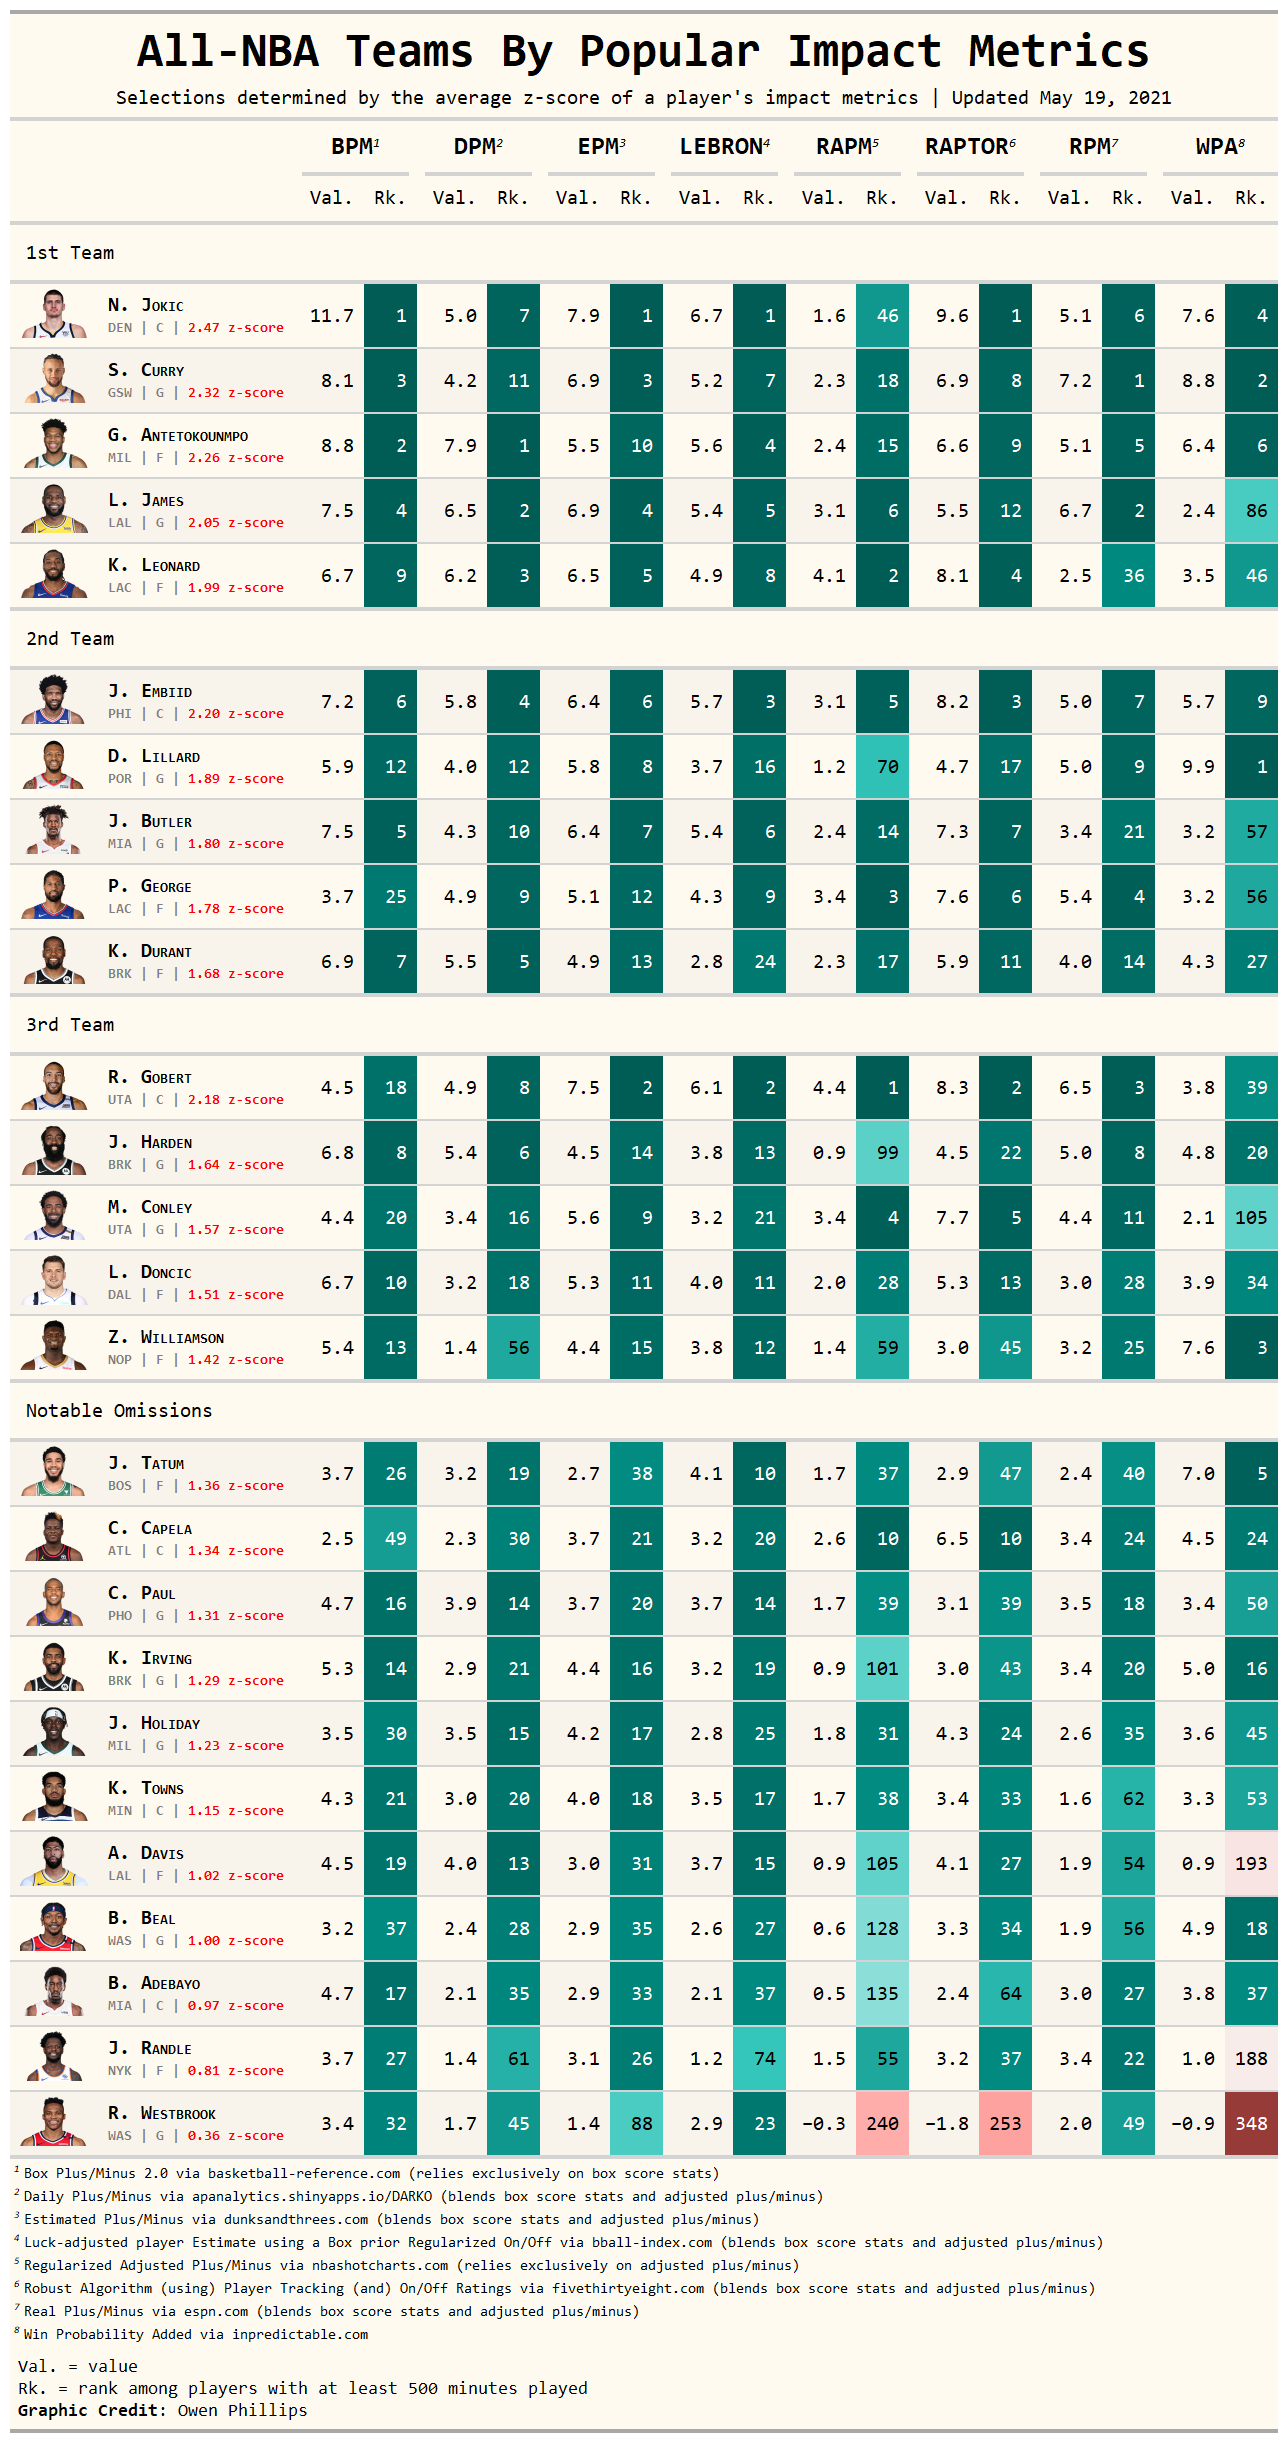
So without further ado, here are the All-NBA teams if they were selected based on a handful of popular impact metrics1.
Similar to Mike Schoppmann’s recent analysis in which he combined multiple metrics into one, I calculated each player’s average z-score across all the different impact metrics in order to create … an all-in-one metric that summarizes all the different all-in-one metrics. There’s probably a good argument that not all of these metrics should be weighted equally, but I’m trying to make as few arbitrary decisions as possible here.
Nevertheless, a couple of things jump out to me from these selections:
Even in a wonky season like this one, these metrics do a nice job of separating out the league’s top end talent. You can quibble with one or two selections or argue that player A should be on the First Team while player B should be on the Third Team, but overall I’m pleasantly surprised at how well these metrics were able to suss out the 15 most impactful players in a shortened season. I think if a voter a submitted a ballot identical to this one it would age fairly well.
That said, this list of selections really drives home the point that narrative voting is not only good, but necessary. Julius Randle is all but assured to make an All-NBA team after having a break-out season and leading the Knicks to their first postseason appearance in what feels like forever. But if Randle were judged exclusively by his impact metrics he’d be a fringe All-NBA candidate at best. It’s important that we have a voting body that can take into consideration that the Knicks are a cursed franchise and that playing in New York is like playing a video game on hard mode. You deserve extra credit when you do succeed there.
Lastly, games played really shouldn’t factor that heavily (if at all) into All-NBA teams, especially since these selections impact a player’s future earnings. A player shouldn’t miss out on a bigger pay day just because they happened to miss half a dozen more games than another player due to health and safety protocols or some other reason beyond their control.
Ultimately, the All-NBA teams are meant to be a reflection of the players mattered most in a given season. There are only 15 slots and voters can tie themselves into knots explaining their rationale for deciding why they’re voting one way only to contradict themselves the following year. The nice thing about using impact metrics to base one’s All-NBA selections on is that in addition to being 100 percent transparent, you can recycle the same methodology year after year and still expect to produce a sensible list of the players who mattered without worrying about contradicting yourself.
Every Team’s Favorite Spot
The following chart shows the spots on the court where each team takes more field goal attempts from than the league average team.
I made a similar version of this chart after the trade deadline, but now that we have a full season’s worth of data I think it’s worth revisiting.
I’m especially intrigued by the teams that tend to take more shots from the mid-range relative to the league average. Teams like the Los Angeles Clippers, Philadelphia 76ers, and Phoenix Suns all take a relatively heavy dose of mid-rangers, which bolds well for their chances in the postseason. Having players like Kawhi Leonard, Joel Embiid, and Chris Paul that can get to their spots when the defense tightens up can be the difference between a first round exit and a deep playoff run.
They include:
Box Plus/Minus 2.0 (BPM) by Daniel Meyers
Daily Plus/Minus (DPM) by Kostya Medvedovsky
Estimated Plus/Minus (EPM) by Taylor Snarr
Luck-adjusted player Estimate using a Box prior Regularized ON-off (LEBRON) by Krishna Narsu and Tim/Cranjis McBasketball
Regularized Adjusted Plus/Minus (RAPM) by Ryan Davis
Robust Algorithm (using) Player Tracking (and) On/Off Ratings (RAPTOR) from fivethirtyeight.com
Real Plus/Minus (RPM) from espn.com


