One of my longstanding NBA beliefs is that most players already shoot the amount of the threes they should be taking — at least directionally speaking. The best shooters take the most threes while the worst ones take the least.
There are some exceptions, of course.
Kevin Durant and Karl-Anthony Towns probably don’t take enough. Russell Westbrook and Giannis Antetokounmpo probably take too many. But by and large, the league’s best shooters bomb threes on high volume and the league’s worst shooters only attempt threes when they’re left open.
So when I’m skimming player box scores I barely look at shooting percentages. Rather, I’m looking for volume, specifically three-point volume.
LaMelo Ball attempting 50 threes over his last three games tells me more about who he is as a three-point threat than the 34% three-point percentage he posted across those three games.
With that in mind, at this point in the season, I find it more instructive to sort leaderboards by three-point volume than by three-point percentage. Good shooters know they’re good shooters, regardless if their shots are going in at first.
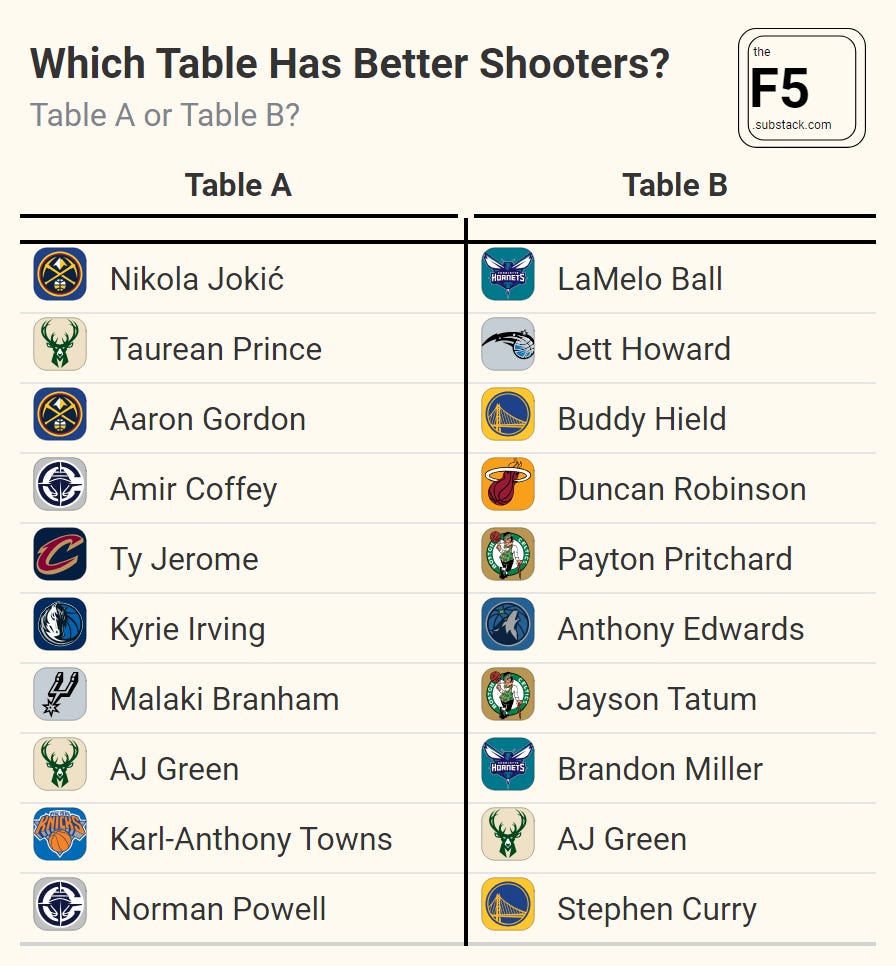
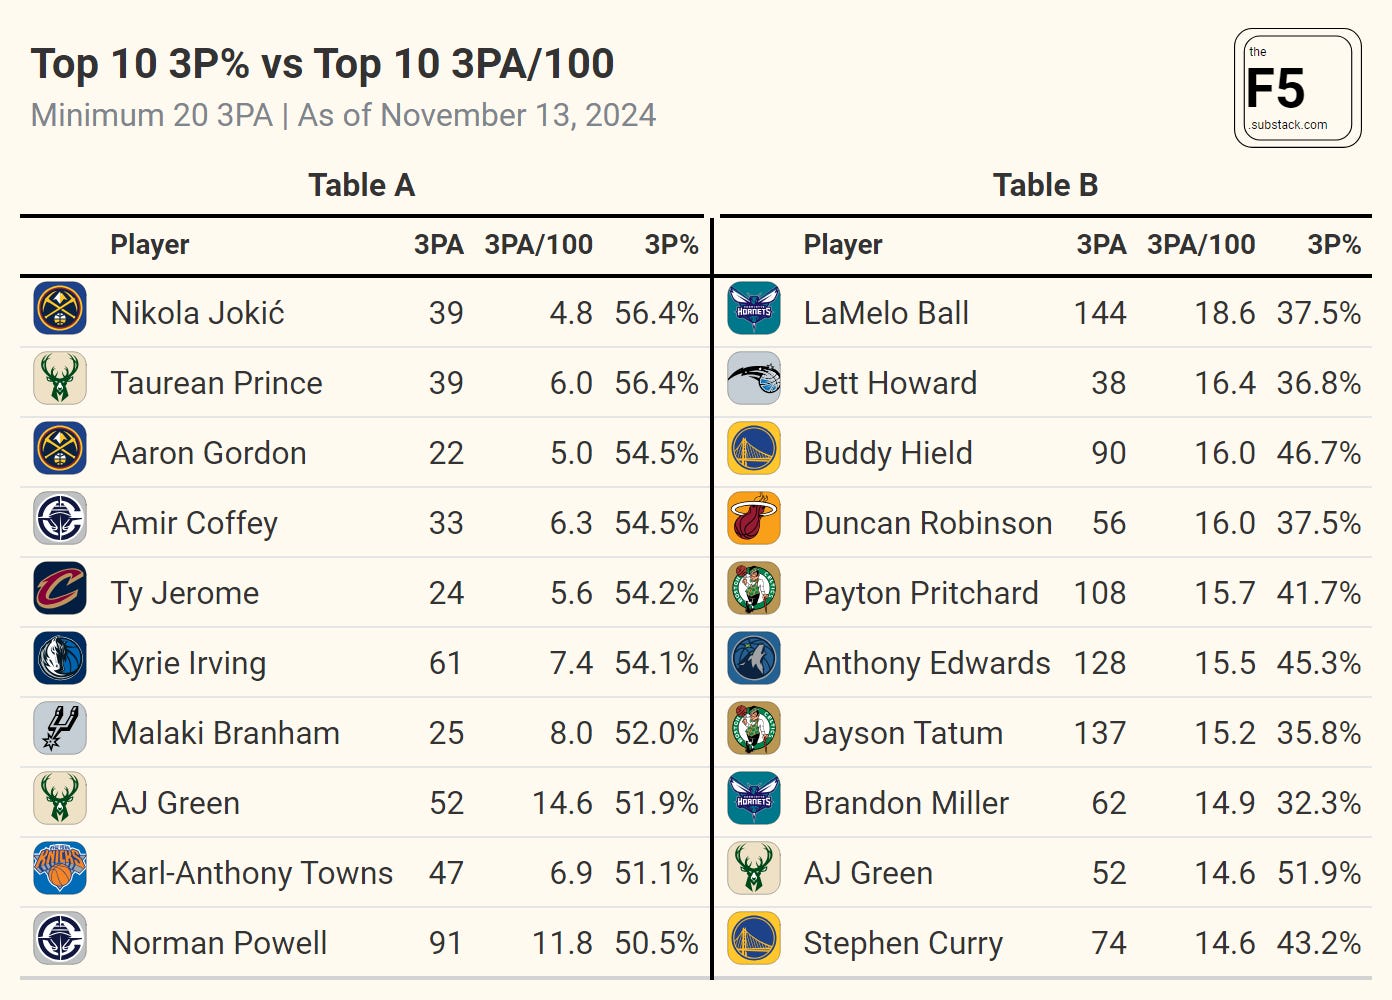
To demonstrate this point, compare the players in the two tables below. Which would you say has the better shooters? Table A or Table B?
My answer to this is Table B, which is the the top ten players in three-point attempts per 100 possessions1. Meanwhile, Table A is a list of the top ten players in three-point percentage2.
It’s not that Table A has bad shooters. It’s just that Table B is a who’s who of some of the best shooters in the league and Jett Howard.
Ultimately, a player’s three-point volume early in a season tells you a lot more about who they are as a shooter than their three-point percentage. Opposing teams understand this as well and develop their defensive game plans accordingly.
Defenses are not selling out to run Toumani Camara off the line even though he’s shooting 45% (18/40) from beyond the arc. At the same time, a defender will stay in Anfernee Simons hip pocket all game despite him shooting just 30% (26/87) to start the year.
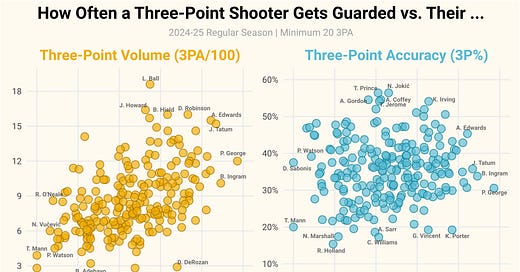
The charts3 below illustrate this point nicely. Here, I’ve shown how often a player is guarded on their three-point attempts this season4 compared to their three-point volume and their three-point accuracy.
Even though it’s early in the season, it’s clear which of the two charts shows a stronger relationship.
You can draw a upward-diagonal line through the points in the chart on the left, meaning that as a player’s three-point volume increases so does the attention of the opposing defense. This also works in reverse. In other words, defenses don’t even get out of bed to guard opposing shooters that attempt less than five threes per 100 possessions.
Meanwhile, there’s hardly any correlation between how often a player is guarded on their threes and their three-point accuracy. This suggests that accuracy alone is not a good indicator of how much defensive attention a player receives.
This dynamic isn’t a function of early season small sizes . Here’s the same charts based on last season’s data using a higher three-point attempt threshold (100 three-point attempts).
The reason I mention of all this is because it doesn’t matter if a player shoots the ball well on low volume. Defenses will treat them as a non-shooter all the same.
This can be a hard lesson to learn for fans that are excited about a player on their favorite team that is suddenly starting to take threes.
For example, Bam Adebayo.
While Adebayo has already taken more than half as many threes as he did all last season, he’s still only taking 3.3 per 100 possessions (223rd out of 226 qualifying players behind Sabonis, Mobley, and DeRozan5). That number is far more concerning about his prospects as a three-point threat than the fact that he’s shooting 22% (5/23) from beyond the arc.
Is That Good
Long-time readers of The F5 know that you can combine a player’s three-point volume and three-point accuracy into a single number to paint a more acurate picture of a player’s “true” shooting ability at any given point during the season.
This technique, which I first learned about from Kostya Medvedovsky (creator of DARKO), is known as the “padding method.”
Essentially, the padding method assumes a player is more likely to be a league average shooter than not and gradually relaxes that assumption with each increasing shot attempt. As a result, players that shoot a high (or low) percentage on lots of attempts get pushed to the top (or bottom) of leaderboards. Meanwhile, players that shoot any kind of percentage on few attempts get squished into the middle.
This is particularly useful early in a season where variance (read: luck) plays an outsized role in determining a player’s raw shooting percentages. With the padding method, we can have more confidence in saying things like Norman Powell’s scorching start to the season (51% from three on 91 attempts) is more impressive than Larry Nance’s white-hot start (74% from three on 19 attempts).
The table below shows the top and bottom 15 in expected three-point percentage using the padding method.
Are we sure Denver made a mistake letting Kentavious Caldwell-Pope leave in free agency? ¯\_(ツ)_/¯
Diamond Plots
Now that nearly every team has played at least ten games, I think it’s appropriate to bust out the first of many Offensive vs. Defensive Rating charts.
So here’s how every team is performing on offense and defense via a Diamond Plot, which takes a normal X/Y plot and turns it on its head.
You will see many versions of these types of charts in the wild, but the nice thing about Diamond Plots is that teams are naturally sorted top-to-bottom by their Net Rating, which is how most humans read anyway.
A refreshing interview with Jeremias Engelmann, co-creator of ESPN’s original Real Plus Minus (RPM) and developer of xRAPM.
Long before Estimated Plus Minus (EPM) and other VORPS and SHNROPS, ESPN published a metric known as Real Plus Minus (RPM). The metric was introduced in 2014, making it one of the early large-scale public attempts to quantify the hidden impact of NBA players by measuring things found beyond the traditional box score.
ESPN has since stopped publishing RPM (more on that later), but one of its co-creators, Jeremias Engelmann, has recently started producing a more modern version on his own site xRAPM.com.
The reason I know that the data behind xRAPM is legit is because the UI on the website is barebones HTML. Many of the NBA data sites I trust the most (pbpstats.com, darko.app, inpredictable.com) are similarly muted in their presentation.
Engelmann, originally from Germany, has worked in the front offices of both the Phoenix Suns and Dallas Mavericks.
I emailed back-and-forth with Engelmann about developing xRAPM, what he thinks happened to ESPN’s Real Plus Minus, and his thoughts on why American Centers are falling behind their international counterparts.
This Q&A has been edited for length and clarity
The F5: What was the inspiration for creating xRAPM?
JE: ESPN's Real Plus Minus, which came out in 2014, was actually just a re-brand of xRAPM, which I had started developing and publishing in 2013.
At that time, I was simply trying to develop NBA metrics that were as accurate as possible, wanting to know whether my personal instincts on 1990s players I grew up with, were correct.
I need to credit Joe Sill here, who won the best paper award at Sloan Sports Analytics Conference in 2010. He made the field a lot attractive to me by injecting some science into it, whereas historically people had mostly - in part because of a lack of computing power and good statistical tools - made subjective decisions and evaluations.
It became clear to me after a while that the concepts originally developed by Dan Rosenbaum - Adjusted Plus Minus coupled with a Statistical Plus Minus - seemed to lead to good and interesting results. So I started fixating on those, while trying to fine-tune all of the steps involved
What makes xRAPM distinct from other all-in-one metrics (BPM, EPM, DARKO, LERBON)
BPM is its own category. It's not even trying to incorporate lineup-, or even newly available hustle data, as its creator wants it to be applicable in different leagues, and I respect that.
Without looking under the hood of these other metrics, it's impossible to know what exactly is different, as tiny changes in implementation can greatly influence the end result.
Building a metric involves lots of steps, and many of them require careful considerations.
What's your raw player and play-by-play data? How are you parsing the play-by-play into lineup data; mean regressing the player stats; weighing older data. Which RAPM (Regularized Adjusted Plus Minus) version do you use to build your SPM with? Do you use any kind of age-, or rubber-band-adjustments throughout the process - those are just some of the questions one has to ask themselves.
There are lots of opportunities to make mistakes of different severity.
For example: When someone posted an incorrect implementation of RAPM many years ago, many people - including one of the above metric's creators - ended up simply copying and using it.
Very generally - and I'm trying to avoid calling out specific names here - I feel like some metric creators just aren't doing clean science. Whether it's overly highlighting "3-point-luck adjustment", which has never been shown to meaningfully increase accuracy. Or by blatantly forging test results in favor of their metric, in what are already poorly designed testing methods that fly in the face of data science
You were one of the original creators of ESPN's Real Plus Minus (RPM), which underwent so many changes that it stopped passing any kind of sniff test. What was it like to watch RPM go through so many changes over the years while you were working in the Mavericks front office.
I was a bit baffled at first, and took me a while to put all the pieces together to figure out what went wrong.
I had left them with, what I felt, a good deal of documentation. But I found out quickly that some of the people who were at that time tasked with implementing it at ESPN - they're all gone now - weren't all that great at reading comprehension. Another one of them appeared to have an extremely poor understanding of data science and analytical concepts, which I realized when working with him and, ironically, from reading his PhD thesis.
It also probably goes back to what I was saying earlier: There are lots of ways to do things differently when building metrics. If it's just someone's side-project while they're working at a big company, with basketball and the NBA maybe not even being their main sport, they're likely to make mistakes.
By now I've gotten mostly used to the fact that ESPN is making suboptimal decisions with many of their projects, and also in regards to whom they're hiring and firing
Who is your guilty pleasure NBA player? Someone who grades out as mediocre or poor in advanced metrics but you enjoy watching nonetheless.
These days I enjoy good defense more than good offense, so I'm going to give a shoutout to Maxi Kleber, who I always feel is one of the best defenders in the league, even if the metrics don't quite bear it out. I specifically like how he's not afraid to land on posters, which at least sometimes leads to amazing blocks.
In the past I've been a big fan of in-traffic, in-your-face dunkers like Antonio McDyess and Stromile Swift, the latter being rated an ice-cold -3.8 in my 29-year RAPM
Are there any specific in-game strategies you think coaches/teams are currently underutilizing?
Despite the 3-point craze there still appear to be teams that can take fewer long 2s, especially at the start and middle of the shot clock
Also, I think, teams that are near the bottom in offensive rebounding can probably crash more, as there are less diminishing returns from 1 guy (instead of 0) crashing, compared to 4 crashing instead of 3
Over the summer, Dennis Schroder got a lot of attention for saying, "European basketball is no entertainment, it's straight IQ basketball, straight coaching." I think everyone agrees there are differences between the NBA and international basketball, but how do you feel about Schroder's comments?
I don't ever take anything Dennis says seriously. The last video I watched of him got rightfully bombarded by negative comments, as he seemed very much out of touch with reality, blaming other people for his own past mistakes. It ended up getting deleted by him or his people within 48 hours.
That being said, of course anything non-American tends to be less about entertainment - Americans are a lot better at presentation and making things more entertaining.
That doesn't imply that the NBA is less about basketball IQ or coaching though.
Last year, eight of the top ten players in rebounds per game were European Bigs (Sabonis, Gobert, Jokic, Giannis, Nurkic, Wemby, Capela, Vucevic). Do you have a sense for why Europe has had more success developing Bigs than America has?
I'm going to blame the American healthcare system at least partially. If a doctor's visit costs a family thousands of dollars, that will ultimately leave a couple of kids behind that could've made it big.
In France - maybe coincidentally a country where many recent top-10 picks are from - a 1-hour physical therapist appointment, with no insurance, costs around $25. Imagine that in the US
Additionally, nutrition and nutritional education seems problematic in the US as well. I'm guessing European children also spend a lot more time outside, which is probably good for their development, because European cities are a lot more walkable
What was it like watching your former team (the Mavericks) in the Finals last year? Were you rooting for them?
I was rooting mostly for some people in the analytics department and some of the players.
I wasn't rooting so much - again not naming anyone - for some other Mavs who are known to undermine democracies.
It was a mixed bad of feelings.
What are you up to now?
When I'm not working on my site I am writing articles with Royce Webb.
Minimum 20 total three-point attempts
Also, Minimum 20 total three-point attempts
Using the percentage of their three-point attempts where a defender was within six feet at the time of the shot
Once again, minimum 20 total three-point attempts


interesting concept, thanks for sharing!
Great article. You do miss that Curry's percentage is much lower due to the number of desperation shots he regularly takes at the end of quarters. His real percentage should be much higher...