
A Chet Holmgren Approved Guide To The NBA Finals
Plus, a Q&A with The Jez Dispenser

Editor’s note: I’ve been a little tied up the past few days with life outside of The F5 so I’m going to take a page out of one of Chet Holmgren’s book and use a few more charts and a few less words this week than usual. That means this post will likely be too long for your email client so I encourage you to click the title of this email to view it in full in your browser.
Scroll to the end for a refreshing text-based Q&A with Cory Jez.
Tyrese Haliburton posted his lowest Usage Rate of the NBA Finals in Game 5. The only player on the Pacers with a lower Usage Rate in Monday’s game was Tony Bradley, the Pacers’ backup Center. Haliburton’s 12.8 percent Usage Rate was the lowest of his playoff run and the fifth lowest on the entire season.
To give you a better idea for how much an outlier it was, take a look at the chart below. I’ve put each player’s Usage Rate from Game 5 in contrast to their Usage Rates in all other games from this season.

Haliburton is not your heliocentric Usage Rate monster, but his paltry Usage in Game Game 5 mirrors his overall production in the game as well. The chart below is similar to the one above, but this time it shows each player’s Daily RAPM Estimate1 (DRE) in every game this season. Haliburton’s performance in Game 5, at least from a box score perspective, was among his least impressive this season.

But that’s kind of just how it goes with Haliburton. There are few players that can reach his highs and there are even fewer players as good as him that turn in stinkers as often as he does.
To illustrate this idea, I charted every player that received at least one All-NBA vote and their distribution of DRE scores in games this season. I’ve ordered the players by the standard deviation of their DRE scores to highlight how much wider Haliburton’s range is compared to other players that produce at a star-level.

We know Haliburton is dealing with a calf issue, which surely factored into his lackluster performance on Monday. Let’s just hope it doesn’t impact his status or performance on Thursday.
Faces of the League
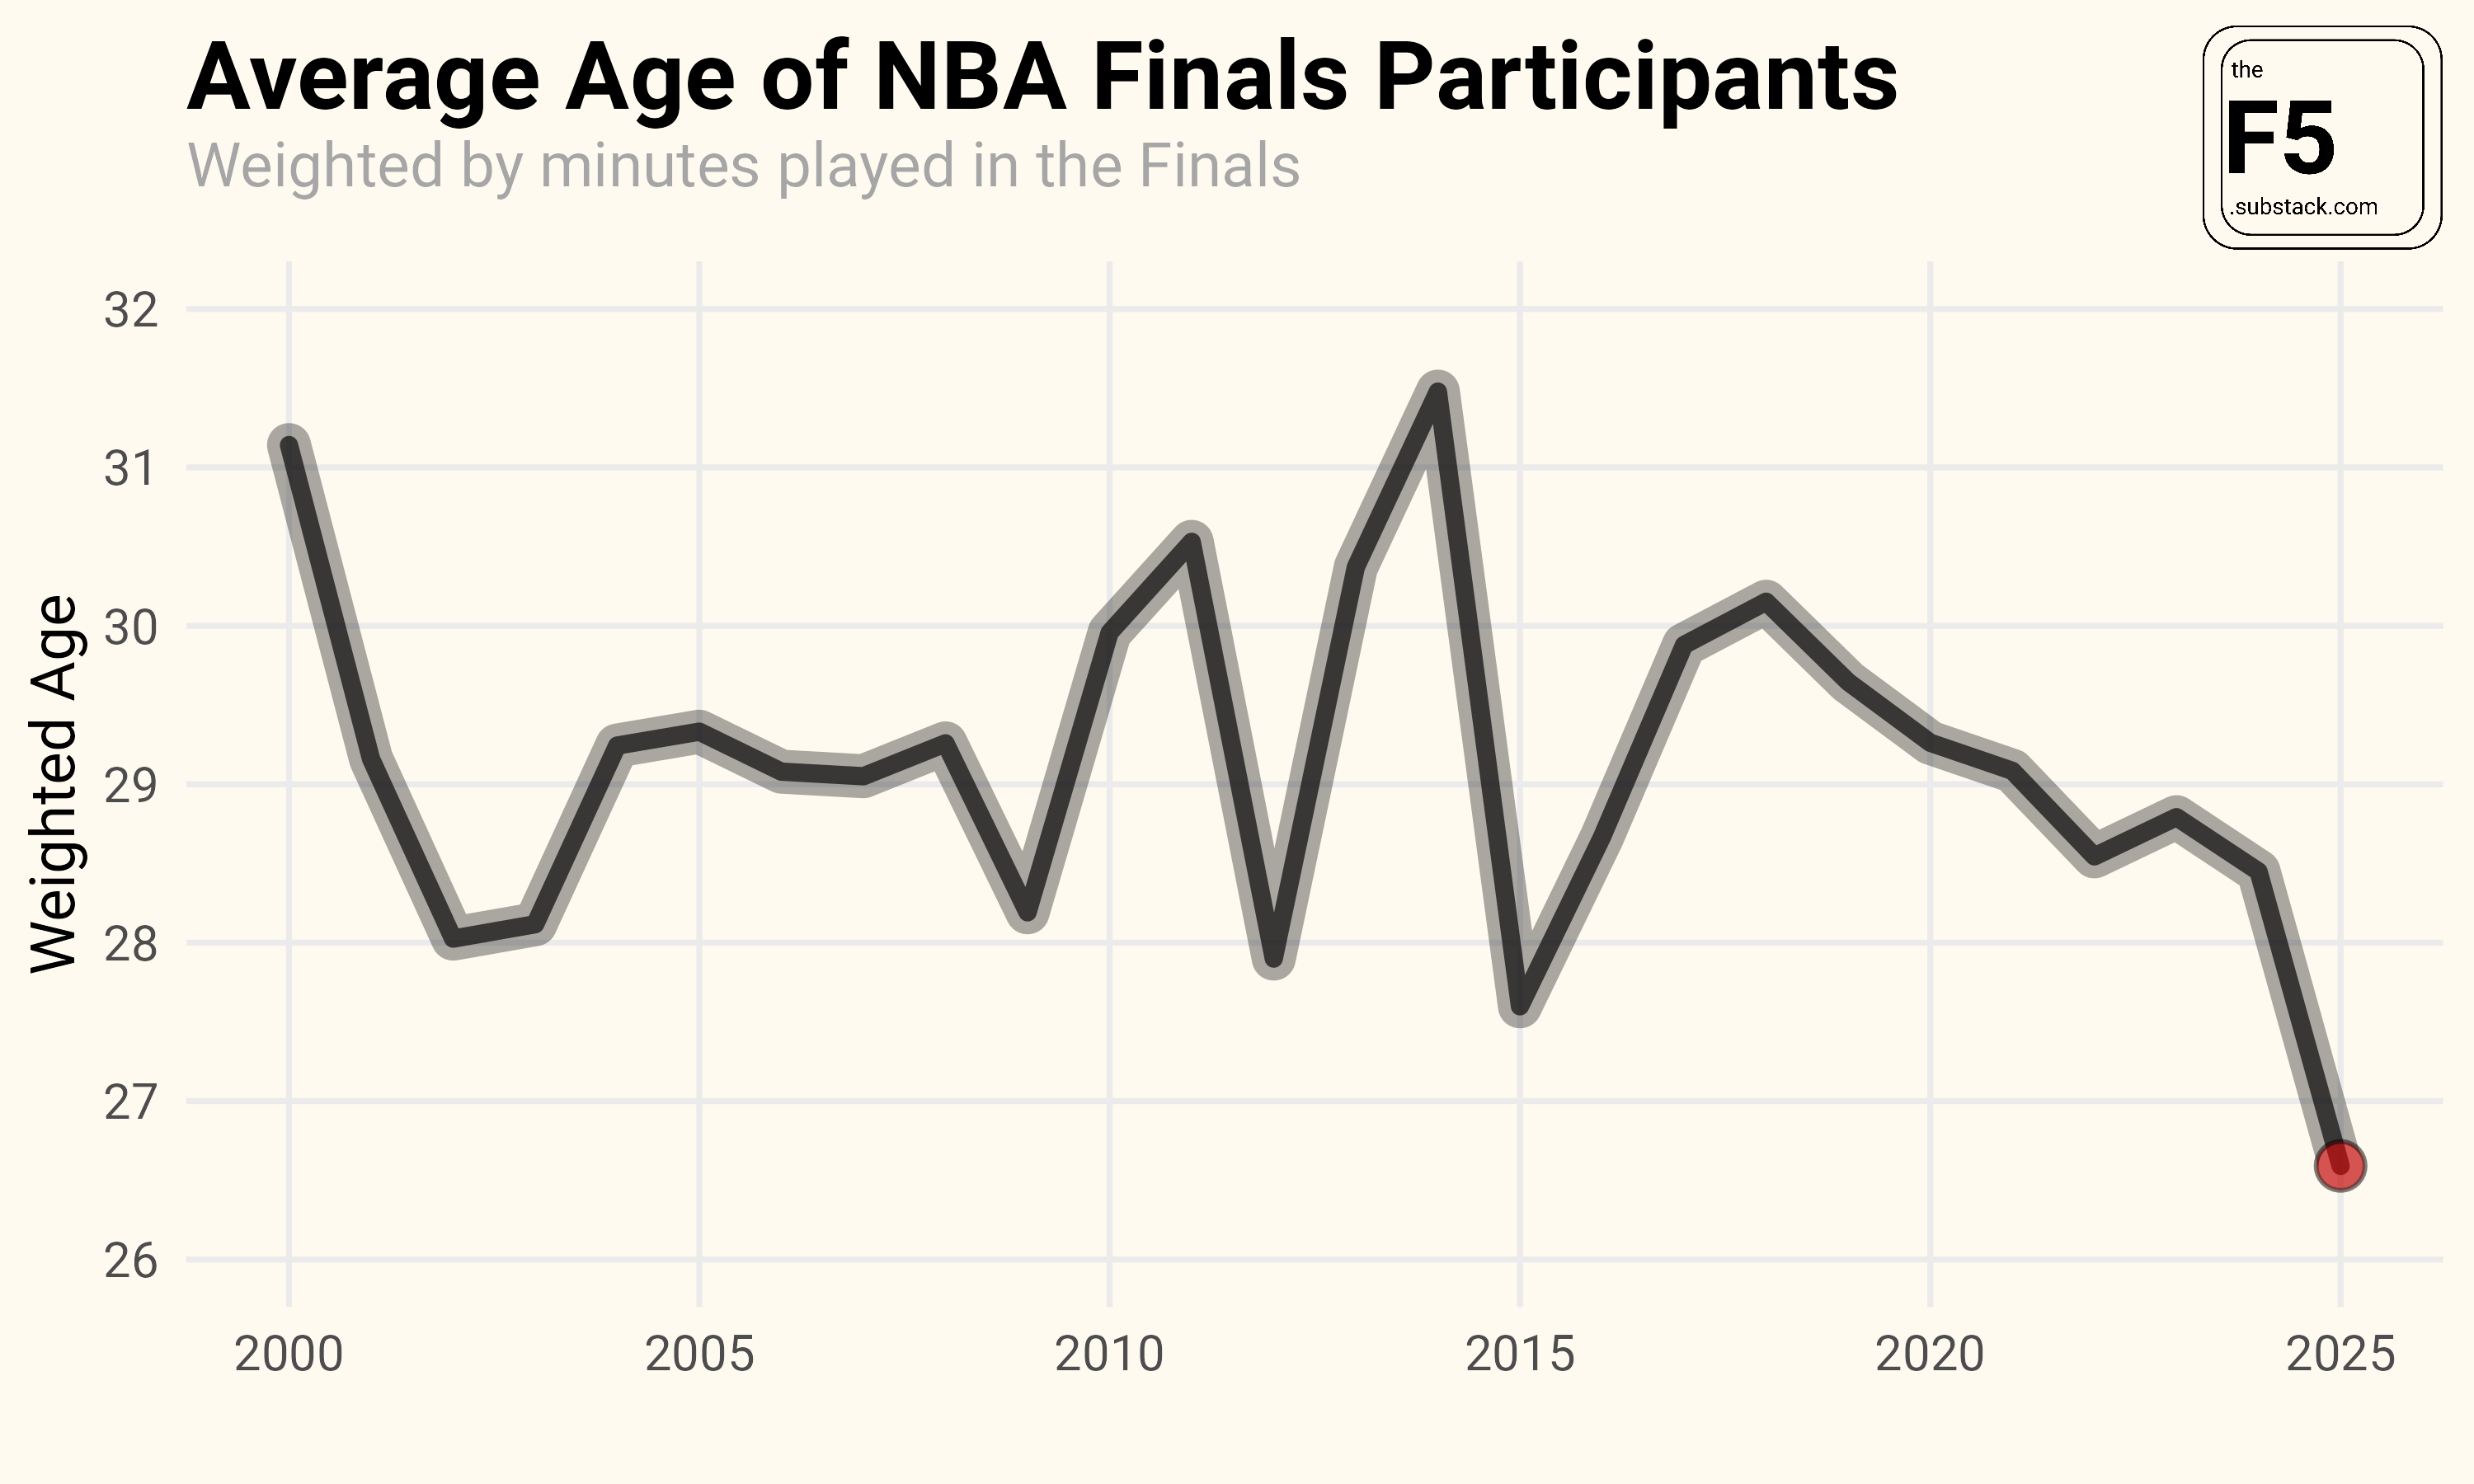
Before the Finals kicked off, Tom Haberstroh wrote about how this year’s matchup would result in the first Gen Z Champion. There are only five players2 over the age of 30 that have even stepped on the court in this year’s Finals. Which is why the average age3 of the players in this year’s Finals is the lowest this century.
I think this chart somewhat explains why there’s been so much conversation in recent months over who the next face of the NBA is — and whether it even matters. Were so used to seeing the old lions like LeBron James, Steph Curry, and Kevin Durant on the biggest stage and now they’re suddenly all on the outside looking in. Meanwhile, the public has far less history with the players in this year’s Finals so it’s natural for there to be a reluctance to accept that the NBA’s hierarchy is in the midst of a changing of the guard.
To back that up, take a look at the chart below, which shows the 100 most followed NBA players on Instagram, according to popularbasketballers.com.

Among players featured in this year’s Finals, none rank higher than 30th (Shai Gilgeous-Alexander) with 4.4 million followers. To put things in perspective, the combined follower count among all players on the Pacers and Thunder is 12.8 Million. That’s less than ten percent of the number of people that follow LeBron alone.
There’s also something to be said about the fact that Gen Z hasn’t embraced Instagram in the same way Millennials have, which may explain why the chart above is littered with players on the wrong side of the Zillenial divide.
Bane Trade
The best thing about the Desmond Bane trade is that it came out of nowhere. There were no leaks. No rumors. I simply woke up and found out that Bane now played for the Orlando Magic. That’s the way it should be.
I wanted to get a sense for how out of the blue this trade was so I reached out to Zach Rodriguez, the founder of Fanspo, which hosts one of the most popular NBA trade machines on the internet. In the last year alone, Fanspo users created more than 120,000 fake trades, according to Rodriguez.
I asked Rodriguez, of those 120,000+ fake trades, how many of them featured Bane being sent to Orlando in exchange for Kentavious Caldwell-Pope and Cole Anthony.
Rodriguez queried his database and wrote back, “After some digging, I was only able to find two trades that involved these three players and only those two teams.”
Only two out of 120,000 trades created in the last year predicted the key pieces in one of the biggest trades this season. That’s 0.001 percent. Further proof that most fake trades are closer to fan fiction than anything resembling reality. `

The other thing to note about the trade is that Bane gives the Magic a good chance of snapping their 14-year streak of being bad on offense. The last time the franchise finished with an above average offense was way back in 20124.
While were at it, we can also spin it the other way and look at each team’s Defensive Rating ranks by season:

Shout out Mike Brown for getting the Sacramento Kings to 14th in Defensive Rating last season. They were in the midst of their own cold streak on that end of the floor until Brown was able to conjure up better than average defensive production from a unit that featured a weak link at Center in Domantas Sabonis. Perhaps that’s why the Knicks, who have their own weak link at Center with Karl-Anthony Towns, are interested in Brown.
A Refreshing Q&A with Cory Jez, Founder of TourIQ Golf
Basketball is the only sport I write about, but I like keeping tabs on what’s going in other sports, particularly in the realm of strategy and analytics. On more than one occasion, I’ve come across a concept in one sport that’s helped me better understand something about the NBA. It turns out, you can actually learn a lot about basketball by simply not watching basketball.
With the NBA season winding down I thought it might be a good time to see what’s going on in the analytics space in other sports. For that, there’s no better person to talk to than Cory Jez, who is the closest thing the sports analytics industry has to a Renaissance Man.
Jez is the founder of TourIQ Golf — an advanced analytics platform designed for pro golfers. Before that, he was the on-air analytics insider for the Portland Trail Blazers broadcast team. In an earlier life, Jez helped build out the analytics departments for the Utah Jazz and Austin FC. He’s also a friend of The F5 and an all around good guy5.
I talked to Cory about his analytics origin story, becoming the data-driven version of Drew Hanlen for golf, and what he has on his second screen when he watches NBA games.
This Q&A has been lightly edited for length and clarity
F5: What’s your origin story in sports analytics? Did you read Moneyball and think, “Hell yeah”?
Cory Jez: Moneyball definitely lit a spark, but the kindling was already there. I grew up in a basketball and golf household—my dad was a D2 hoops player who once held the national assist records, and I played competitive golf through college.
After graduating in 2011 (the same year Moneyball hit theaters—coincidence?), I started in marketing analytics and got obsessed with tools like SQL, Tableau, and Python. By 2014 or so, it was clear that sports and analytics were converging, and I started steering my career in that direction.
You were the Director of Analytics for the Utah Jazz. How much of your job was “doing analytics” vs. scaling up the organization's infrastructure to be able to use analytics. In other words, how much of your time was spent building models vs. building pipelines and delivery systems to support analytics.
This is a great question, and frankly, one that’s often misunderstood. People tend to equate “analytics” with modeling or prediction, but in practice, it’s broader than that. I think of it in four buckets: 1) data engineering, 2) front-end development, 3) modeling, and 4) decision support.
When I joined the Jazz, the infrastructure needed a serious overhaul—so much of my early time was spent moving things to the cloud, standardizing data pipelines, and rebuilding our internal website to be more usable on the road.
Models are table stakes. Impact comes from how effectively you deliver those models to decision-makers. And in a small department, the real trick is doing that while also helping the GM with a trade evalualtion and the coaching staff with a matchup question—often at the same time.
Expecting a single person to be an engineer, a quant, and a communicator is like asking your college scout to rebound for your All-Star after practice. It’s technically possible, but you’re doing it wrong.
You had a take on LinkedIn about the Oklahoma City Thunder’s organizational structure and how it differs different from the typical NBA team. Why do you think NBA teams have been slow to scale up their staffs in the same way OKC has or MLB teams have.
I’ve always admired how MLB teams treat their analytics departments like tech orgs. The NBA’s been slower to catch up, partly because the sport itself is noisier—basketball has more variables and fewer discrete events. That makes it harder to link inputs to outcomes, and ironically, makes analytics even more valuable.

If your sport is chaotic, your process better not be. There’s a real opportunity in basketball to go deeper on things like player development or skill acquisition—just look at how granular MLB teams get with pitching or swing mechanics. I haven’t seen that same level of rigor in the NBA yet, but it’s coming. OKC’s just early.
As far as I know, you were the first on-air analytics insider in professional basketball. What made you want to try that?
When the Blazers approached me, I was surprised—in a good way. The idea came from leadership internally, which showed real buy-in.
I said yes because I wanted to bridge the gap between what teams actually care about and what fans think analytics is. The goal was simple: if this stuff matters to coaches and execs, let’s show fans why. So I talked about things like Four Factors, shot quality, and pick-and-roll matchups—not to impress anyone, just to explain the why behind what we were seeing.
We ran postseason surveys, and a big chunk of fans said they learned new things. That’s a win. Also helps when your broadcast team—Lamar, Brooke, Kevin, Jeff, Dan—are total pros.
And of course, sometimes you get some really funny audio-visual “difficulties”
Do you feel like you thought about basketball differently when watching from a broadcast point-of-view vs. a team (or fan) point-of-view?
Definitely. From a team POV, you're zoomed in—thinking in possessions, matchups, adjustments. As a broadcaster, you zoom out. You’re not just watching the game, you’re thinking: How do I explain this in 20 seconds?
It forced me to translate complex ideas into plain language. I think it actually made me better at my job across the board—if you can explain analytics to a general audience, you can explain it to a head coach or a professional athlete in a succinct manner.
Based on your experience with the Blazers, what are some things you wish you saw other broadcast teams do or talk about more?
There’s a lot of low-hanging fruit here. Most broadcasts treat analytics like a novelty. It’s not. But if you’re going to use it, you have to be consistent—drop “Offensive Rating” once with no context and you’ve lost 95% of your audience.
Amazon’s TNF alt-cast is a great model. They present metrics week-to-week with consistent visuals and framing. Over time, fans get smarter. And smarter fans are more engaged.
I’d love to see more Four Factors, shot distribution, pick-and-roll combos, and maybe even shot quality metrics integrated into broadcasts. It’s not about being nerdy—it’s about being clear.
You’ve worked in basketball, soccer, and golf analytics. I feel like all three of those sports are in different stages of their own analytics revolutions -- where would you place each sport along that continuum?
Golf is ahead in terms of individual customization. It’s the perfect sport for optimization—every shot is a discrete, measurable action. We can build super specific training programs around a player’s game, and build gameplans for the golf course tailored very precisely to the player.
Soccer has made huge strides lately, especially with tracking data and expected goals models, but there’s still some cultural resistance—though it’s fading. Soccer remains more analytically inclined on the sports-science side of the house, and of course the Brentfords of the world have applied it to recruitment and teambuilding with excellent results.
Basketball is clearly in the #2 position in terms of team sports, behind baseball. Teams (like the Thunder) invest a ton of time and energy into leveraging quantitative information across their organization, it also might have some of the largest variance in how much teams are investing in the game as well. While success in the NBA is certainly cyclical, if you think about the teams best-positioned for the next decade (Thunder, Spurs, Rockets, Cavs, among others) all are very strong in this department.
You had a great tweet about sports analytics summed up. I love how almost all of those “insights” have made their respective sport more exciting. And yet there’s a pervasive idea in each sport that nerds have ruined the game. Why do you think there’s such a disconnect between what analytics is doing to sports vs. what people think analytics is doing to sports.
A lot of it comes down to presentation. Analytics tends to enter the discourse as cold, transactional, or smug. That rubs people the wrong way—even if the insights themselves make the game better.

The irony is, analytics often makes sports more fun: more threes, more aggressive play-calling, more informed strategy. But when you frame it as "math vs. vibes," everyone picks vibes. If we framed it as “more Steph Curry, fewer bad post-ups,” people would get it.
You work with professional golfers one-on-one to help them improve their performance using analytics. Do you think that’s something that NBA players would benefit from instead of working out one-on-none with personal trainers?
Absolutely—though I’d frame it as a complement, not a replacement.
With tracking data, we know what skills NBA players need in specific roles. That should inform how they train. If you’re a 3-and-D wing, you should be repping the exact shots and defensive coverages you’ll face in games. Golf does this intuitively: short game work, course mapping, putting drills based on expected strokes gained. Why not in basketball?
Even something as simple as “Here’s George Niang’s shot chart and the $30M he’s made hitting open threes” can be a wake-up call for a young player.
Training should be targeted. Time is finite. Analytics can help you spend it wisely.
I really admire how you’ve forged your own path in sports analytics. What’s the secret?
I’m not sure there’s a secret—maybe just a willingness to chase curiosity and be okay not knowing exactly where it’ll lead.
I’ve said yes to a lot of things before I was fully “ready,” and tried to build real relationships along the way. People talk about networking like it’s transactional. It shouldn’t be. Just try to add value where you can, no strings attached. Weirdly enough, that usually comes back around.
Also: don’t be afraid to share what you’re working on. Putting ideas into the world is how people find yo
What’s one thing you can’t live without during the NBA season?
Cleaning the Glass (CTG), no question.
It’s my second screen during games, and I quoted it all the time on TV. Ben Falk has been a mentor and guidepost for me—his writing is some of the smartest in the space, even if he’s not as prolific now.
If you’re serious about understanding basketball, CTG should be in your daily rotation.
a catch-all metric for estimating player performance with just stats found in the box score. think of it as a more evolved version of Game Score. you can read more about it here
James Johnson (38), T.J. McConnell (33), Alex Caruso (31), Pascal Siakam (31), and Kenrich Williams (30). Johnson played less than three minutes in Game 2 so he just barely counts.
weighted by minutes played
i don’t hold his preference for python against him
Excellent analyst, but who is Owen Phillips?
As someone who recently described a certain figure as the Demar Derozan of Seth Partnow’s (Former NBA analytics guy who is aesthetically pleasing but provides less value than you would think), your the KD in that conversation- your articles always have the best of analysis and visualizations. Any thoughts on why Hali has so much variance in his game performances?