

Welcome back to The F5. This week we’re talking Finals. I've got an analytics cheat sheet and a couple of pieces of minutia that I think help frame this year’s matchup. Also, I have some data on some recent comments made about an NBA player’s feet.
As a reminder, The F5 is a reader supported publication that only exists because enough of you have decided that it’s worth paying $5/month. I write one free post a week that goes out to everyone (the one you’re reading now) and a second post for paid subscribers containing tutorials on how to recreate the visualizations you find in this newsletter. The best way you can support The F5 is by signing up for a paid subscription. The second best way is to tell a friend about this newsletter.
If you’re a student and can’t justify the cost of a subscription, get in touch. If you’d like to sponsor the cost of a subscription for a student, also get in touch.
Styles Make Fights
In 2022, Ryen Russillo opened his show with a monologue on the rise of extreme usage rates in the NBA. More than half of the top 50 usage rate seasons have come in the last ten years. Russillo argued that one-man-band offenses might lead to wins in the regular season, but in the playoffs, where opponents get to see the same thing over and over, it becomes easier to defend and therefore a losing strategy. At the time, Russillo pointed to the fact that only one player with a gargantuan usage rate in NBA history had ever even made the Finals (Allen Iverson in 2001) let alone win it.
This year, Shai Gilgeous-Alexander posted a 34.8 percent usage rate, which would rank as the 44th highest usage rate in NBA history. That’s not quite Houston-era James Harden levels of heliocentric basketball, but it’s not too far off either. The Oklahoma City Thunder cruised the regular season, SGA won the MVP, and now the Thunder are heavy favorites to win the NBA Finals.
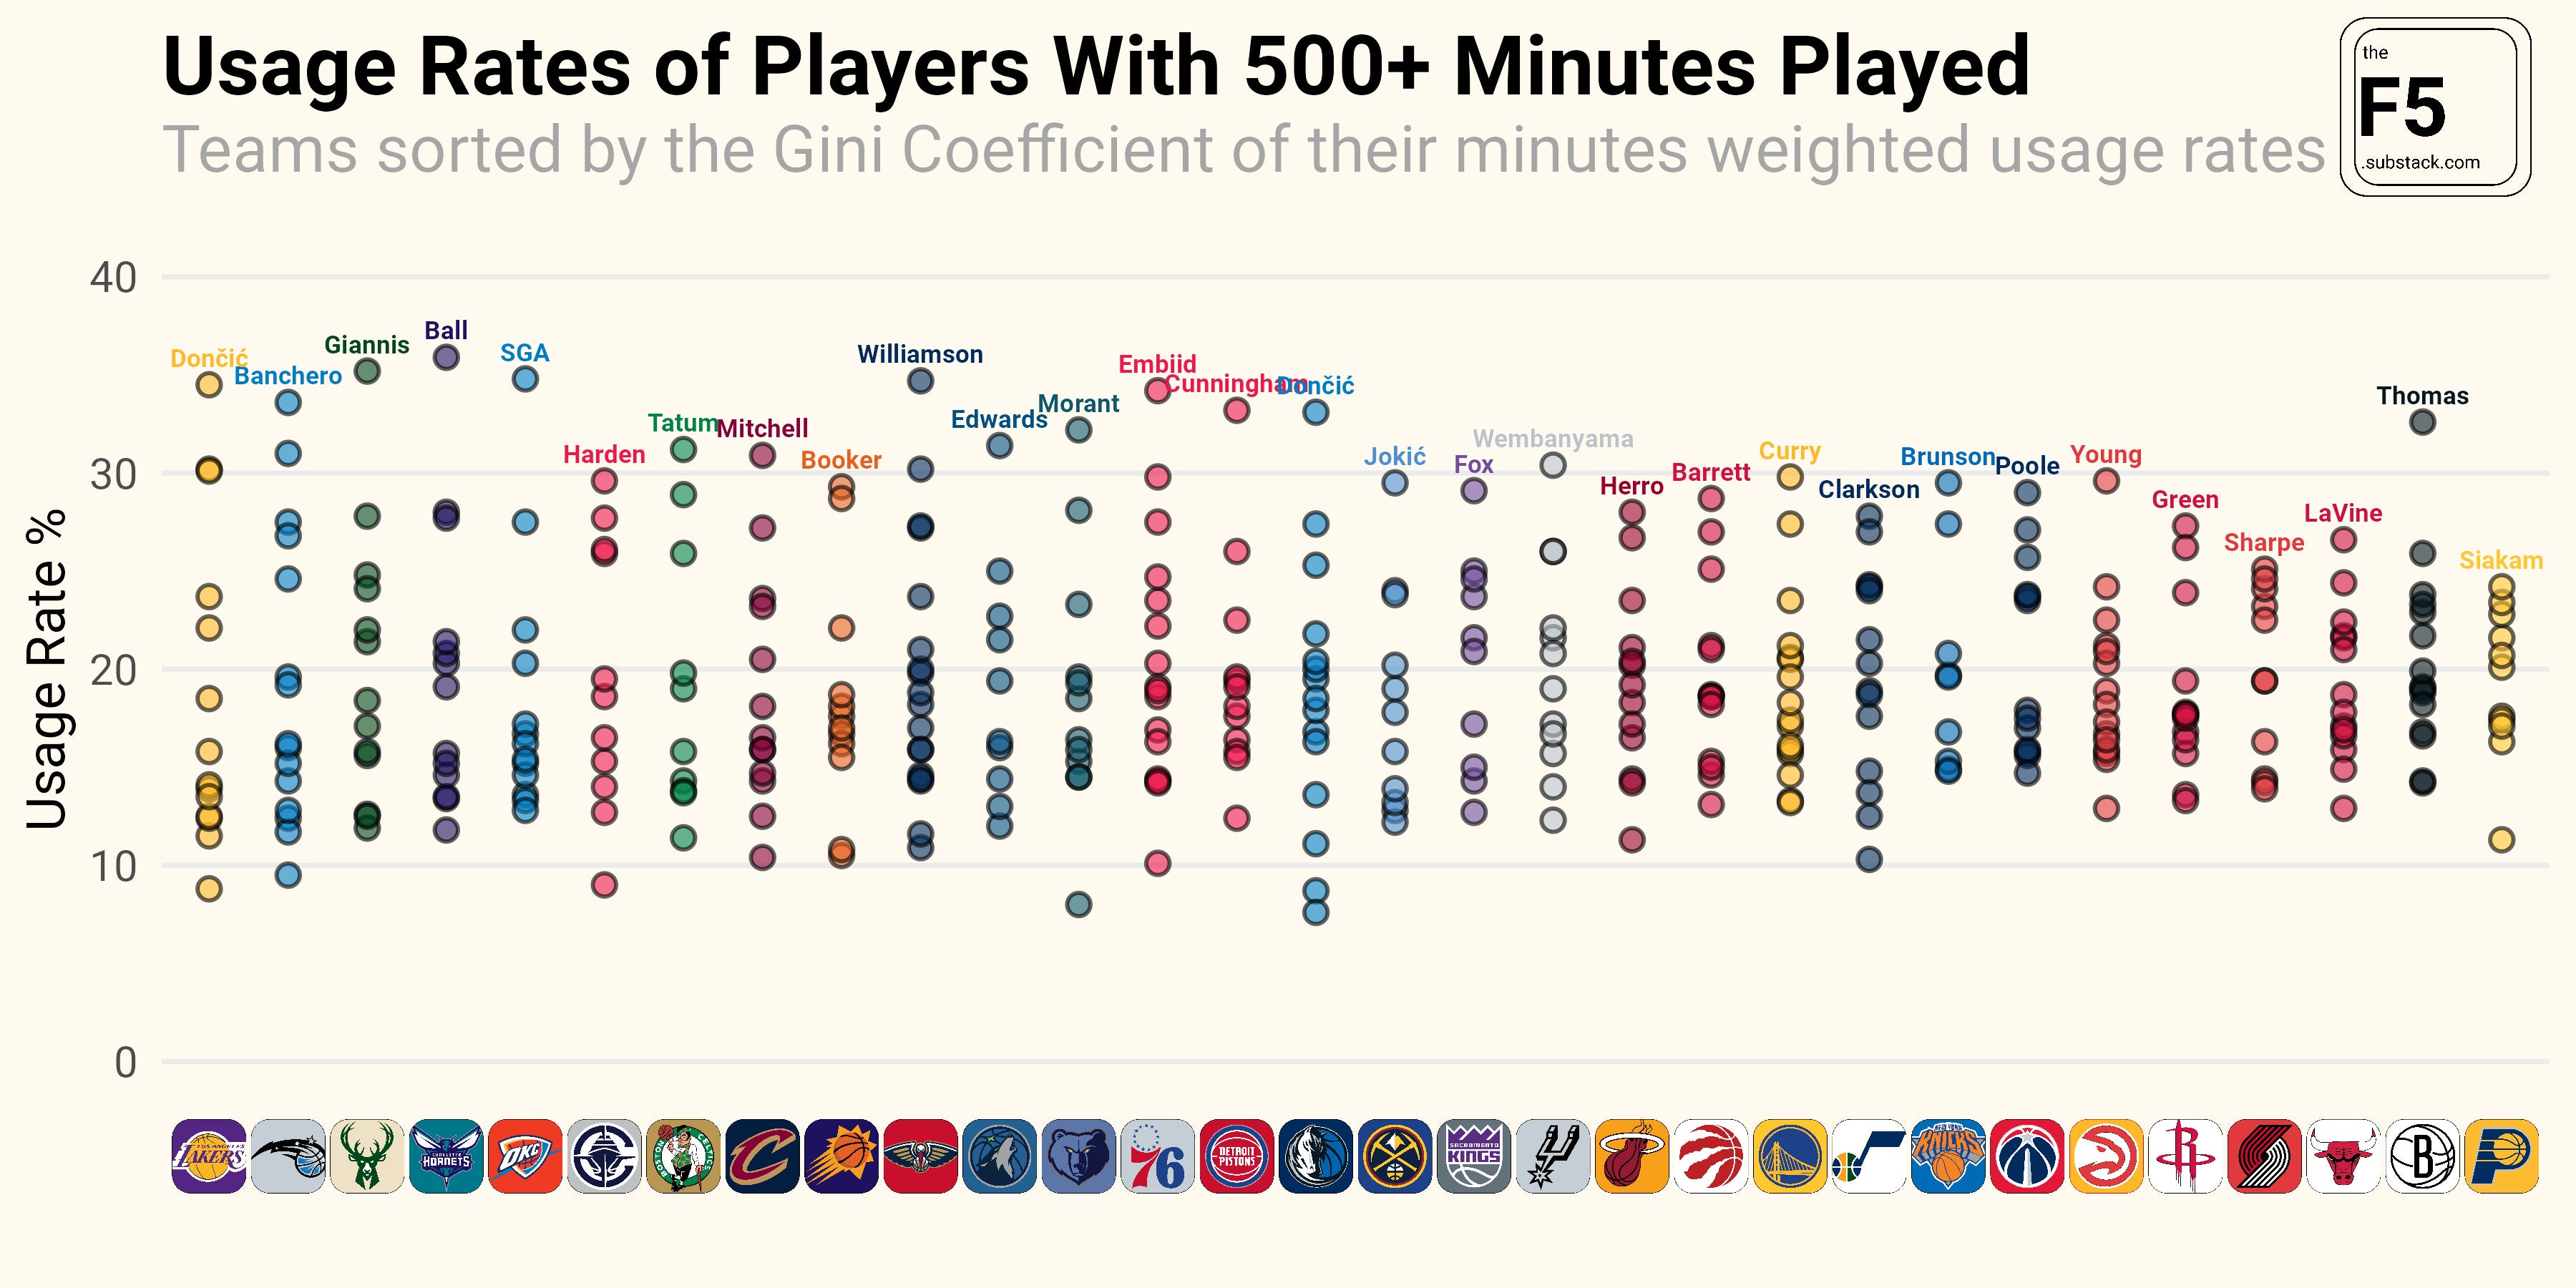
The Pacers are on the other end of the spectrum. They’re the only team that didn’t have a player with a usage rate above 25 percent in the regular season. Pascal Siakam led the team in usage rate at 24.2 percent, while T.J. McConnell (23.4), Ben Mathurin (22.8), and Tyrese Haliburton (21.6) weren’t far behind. The Pacers actually had the most equitable collection of usage rates in the league this year as measured by the Gini Coefficient of their minutes weighted usage rates. The Lakers, who leaned heavily on Luka Doncic and LeBron James for offense, had the least equitable collection of usage rates.
Styles make fights and the Thunder and Pacers couldn’t be more stylistically different from one another on offense. One team leans on their superstar to generate offense for himself and others. The other team prioritizes passes, off-ball movement, and the power of friendship to drum up easy baskets.
The chart below shows the highest usage rate player from each team in each season since 19781. I’ve highlighted the NBA Champion and Runner-Up in each year. This year, the difference between SGA’s usage rate and Siakam’s is the largest gap between usage rate team leaders that have ever met in the Finals.
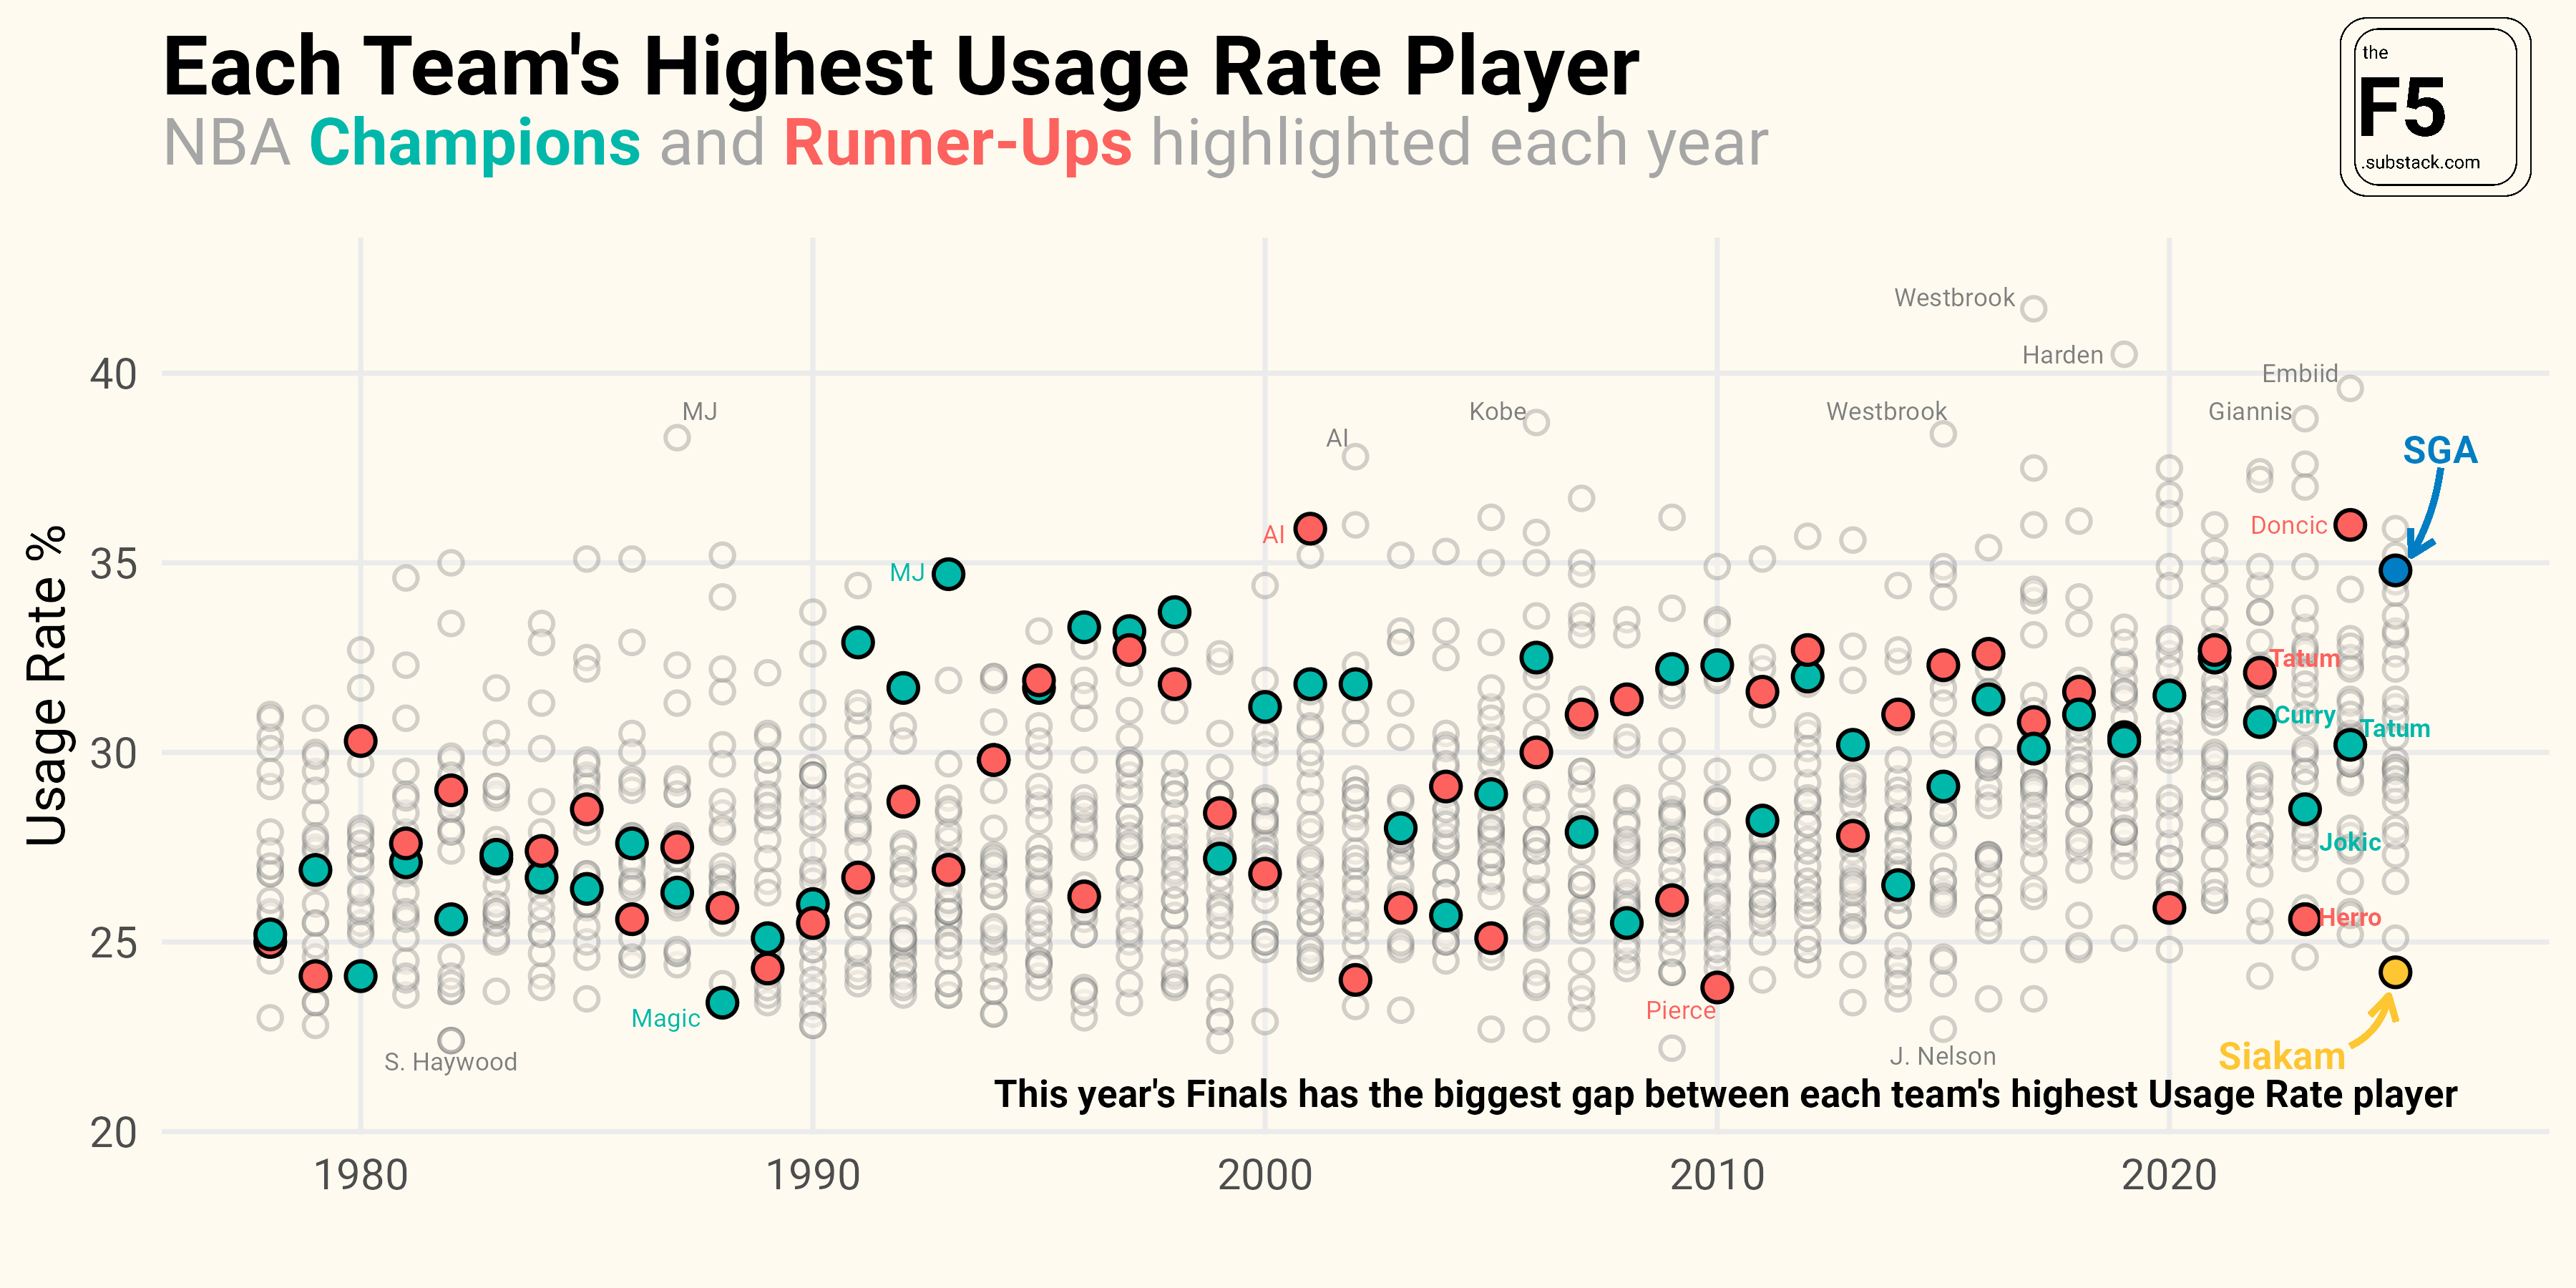
No team has ever won the Finals by relying as heavily on a single player as the Thunder do with SGA2. And yet, they’re four wins away. At the same time, the Pacers divvy up the offensive load in a way that’s uncommon in today’s NBA. You’d have to go back to the 1988 Los Angeles Lakers to find a championship team with a lead player with a lower usage rate than Siakam’s. That year, Magic Johnson led the Lakers to a championship while posting a usage rate of just 23.4 percent.
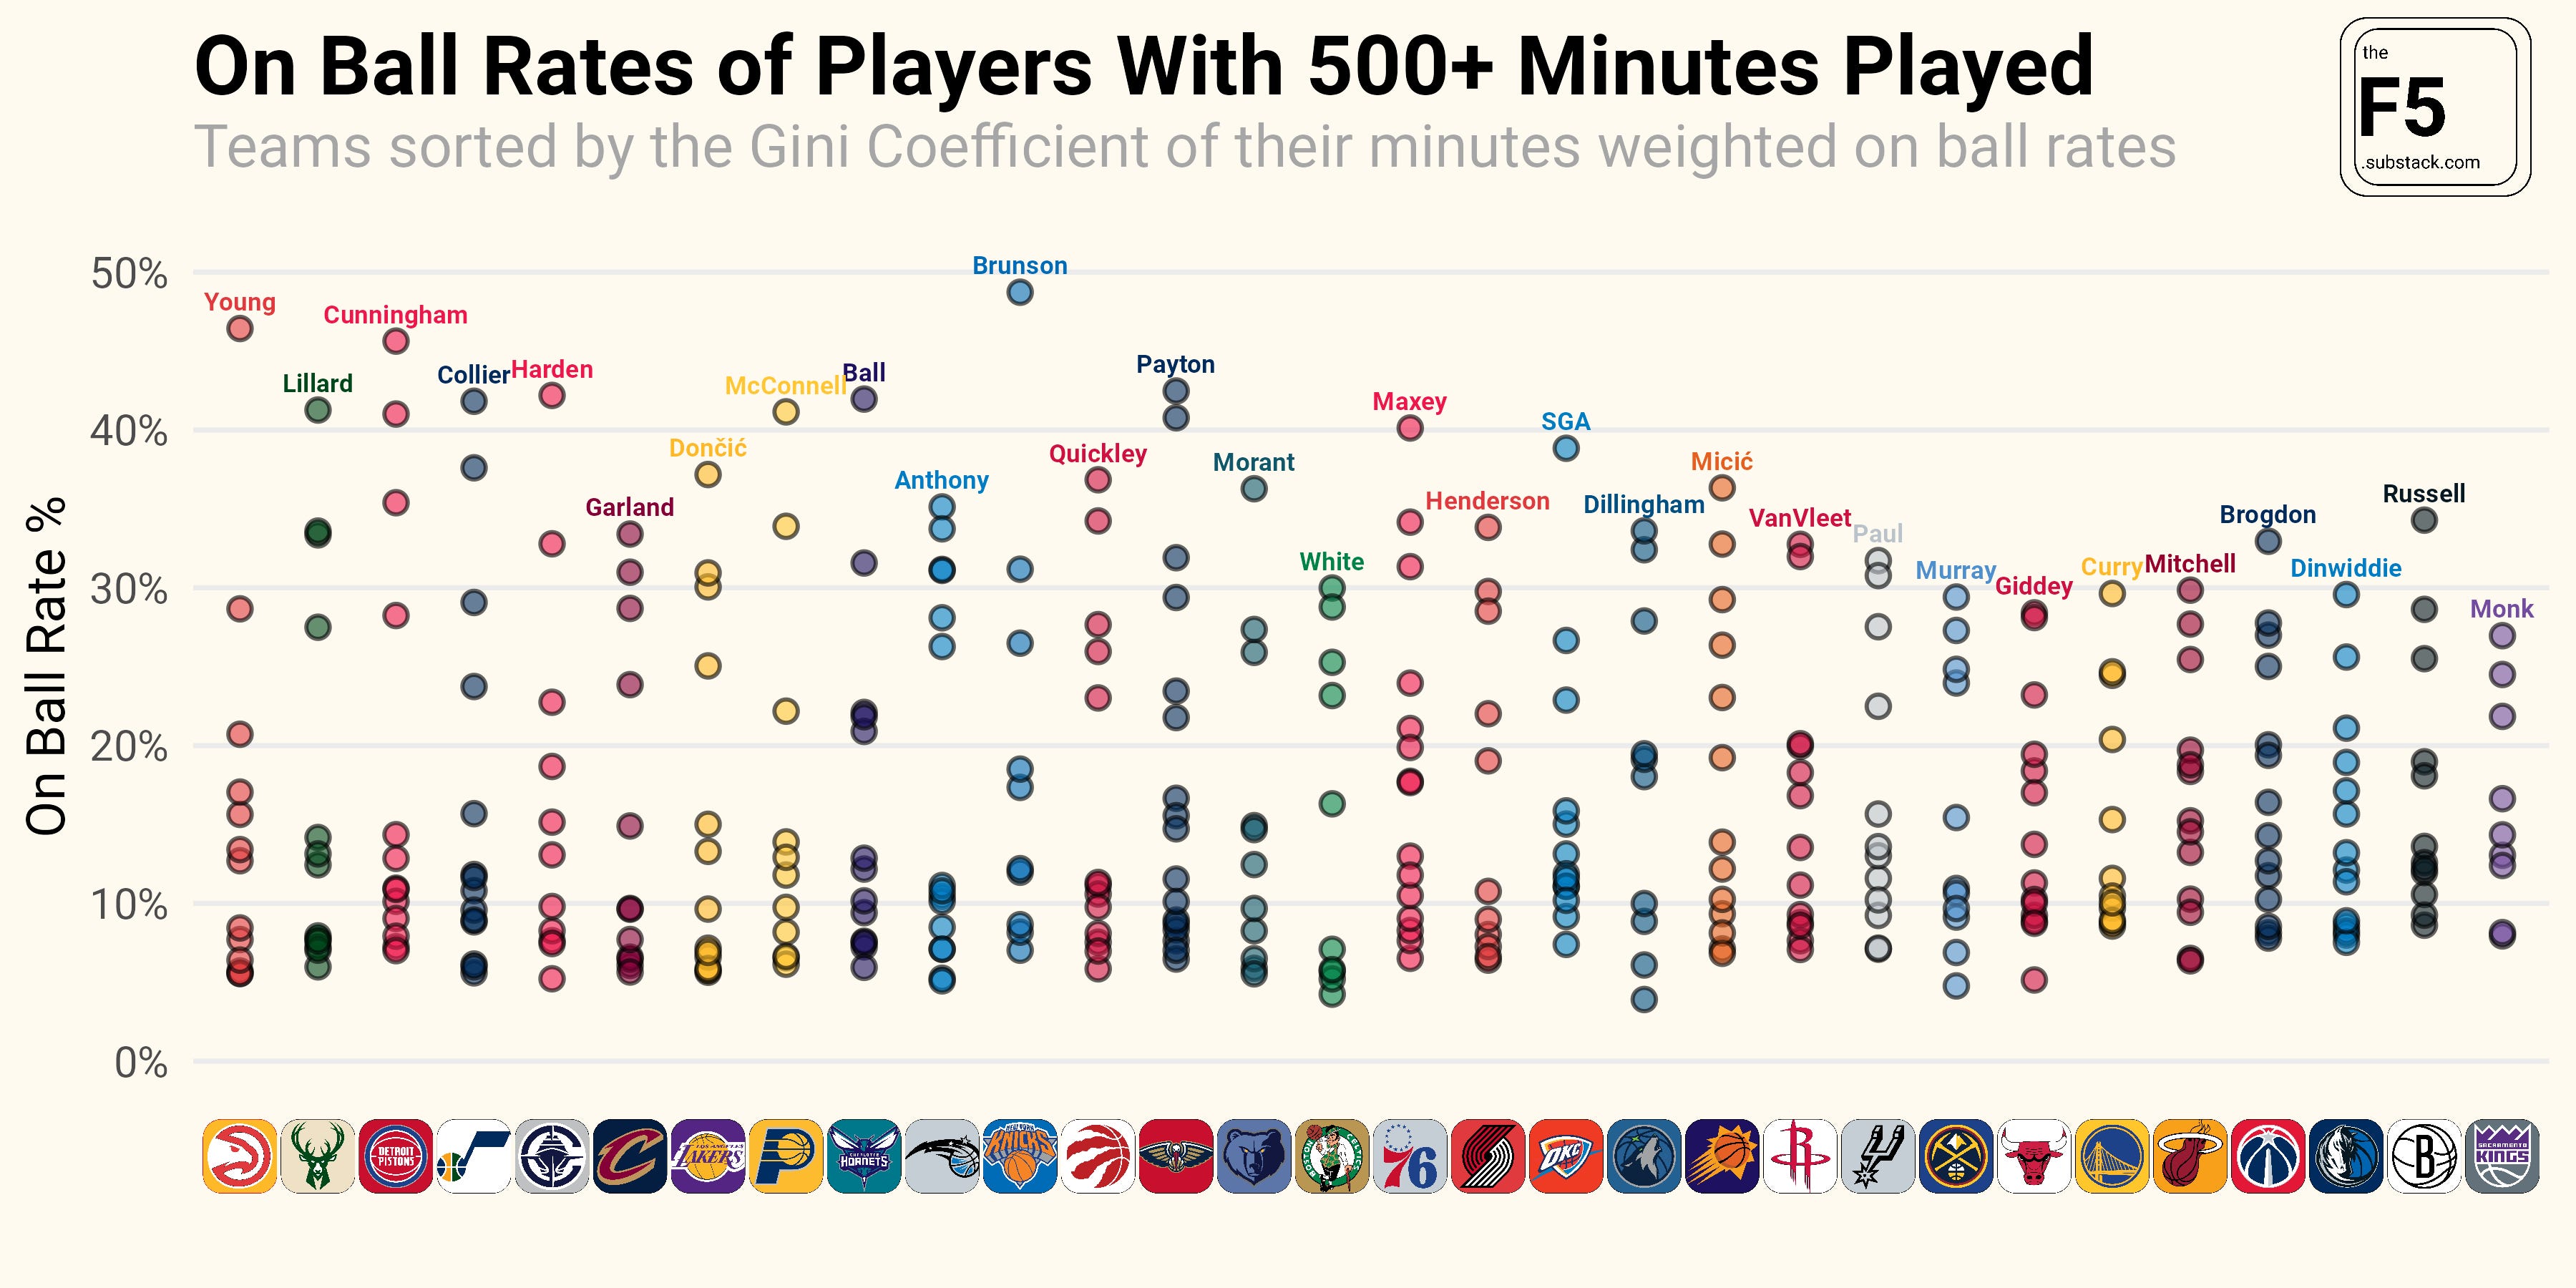
Now is a good time to explain the limitations of looking at usage rate to measure offensive load. Usage rate takes into account how a possession ends — a shot, a turnover, a foul. You’ll notice that I did not mention assists. So a player that makes a living off of setting up their teammates will look less ball dominant than a player that has a lot of turnovers, draws a ton of fouls, or just catches and shoots. For example, Tyrese Haliburton posted a lower usage rate than Malik Beasley during the regular season even though Haliburton is the engine of the Pacers’ offense and was third in assists per game this year.
If we move off of usage rate and use the NBA’s tracking data to measure each player’s time of possession with the ball3, we see that the Pacers are not quite the socialist enterprise that usage rate makes them out to be. In fact, T.J. McConnell actually spent a higher percentage of his on court minutes with the ball in his hands (41 percent) than SGA did (39 percent) during the regular season.
Still, I think there is something that feels uniquely egalitarian about this year's Pacers. We’ve seen throughout the playoffs how they’ve gotten contributions from players up and down their roster. Haliburton and Siakam have turned in star-level performances at times, but some nights it’s the Nesmith Game. Other nights it’s the Mathurin Game.
This isn’t to say that the Pacers’ style is better than the Thunder’s or anyone else’s. Rather I just wanted to point out the stylistic differences bewteen these two teams and how unique it is that they’re meeting in the Finals.
An Analytics Guide to the NBA Finals
Like with all series, I’m sharing my analytics cheat sheet for the NBA Finals. Below you’ll see how the Thunder’s offense matches up with the Pacers’ defense (and vice versa).
I’m showing regular season values and ranks. Some of you might want to see playoff values and ranks, but I’d argue those are less representative of who these teams actually are. In the playoffs, a team’s performance is so much more a function of who they played rather than how they played.

A few thoughts:
Thunder iso-ball. The Thunder have one of the league’s best and most prolific isolation offenses. Meanwhile, the Pacers ranked 26th in defending isolations during the regular season. How will some of the Pacers lesser defenders (read: Tyrese Haliburton) hold up defending one-on-one?
Pacers transition offense vs. Thunder transition defense. Indiana made hay in the open court against New York in the Conference Finals. It won’t be as easy against Oklahoma City, who rarely give up transition opportunities and defend the ones they do give up almost better than anyone else.
Shot Making vs. Shot Quality. Neither of these teams have the most analytics-friendly shot profiles. Both teams take an above average dose of long 2s and a below average dose of 3s and layups. And yet, both teams finished in the top seven in Effective Field Goal Percentage during the regular season. Whatever happens in this series, you can bank on the fact that both sides will feature some tough shot taking and high-level shot making.
Never Tell Rick Carlisle The Odds
The Indiana Pacers are massive underdogs heading into the Finals. As of today, Vegas lists their odds of winning at +500, which translates to about a 16 percent implied probability. If the Pacers were to win they would tie the 2004 Pistons for the biggest upset in NBA Finals history.
But if there’s one coach that’s comfortable defying the odds, it’s Rick Carlisle.
Using the Sports Odds History archive I went back and found the price of each playoff series since 1990 and converted those values to implied probabilities4. I then summed up each value for each head coach during that period to calculate each coach’s Expected Series Wins5.
Once I had an Expected Series Wins value for each coach I compared it to their Actual Series Wins to see which coaches have over- or underperformed Vegas’ expectations the most.
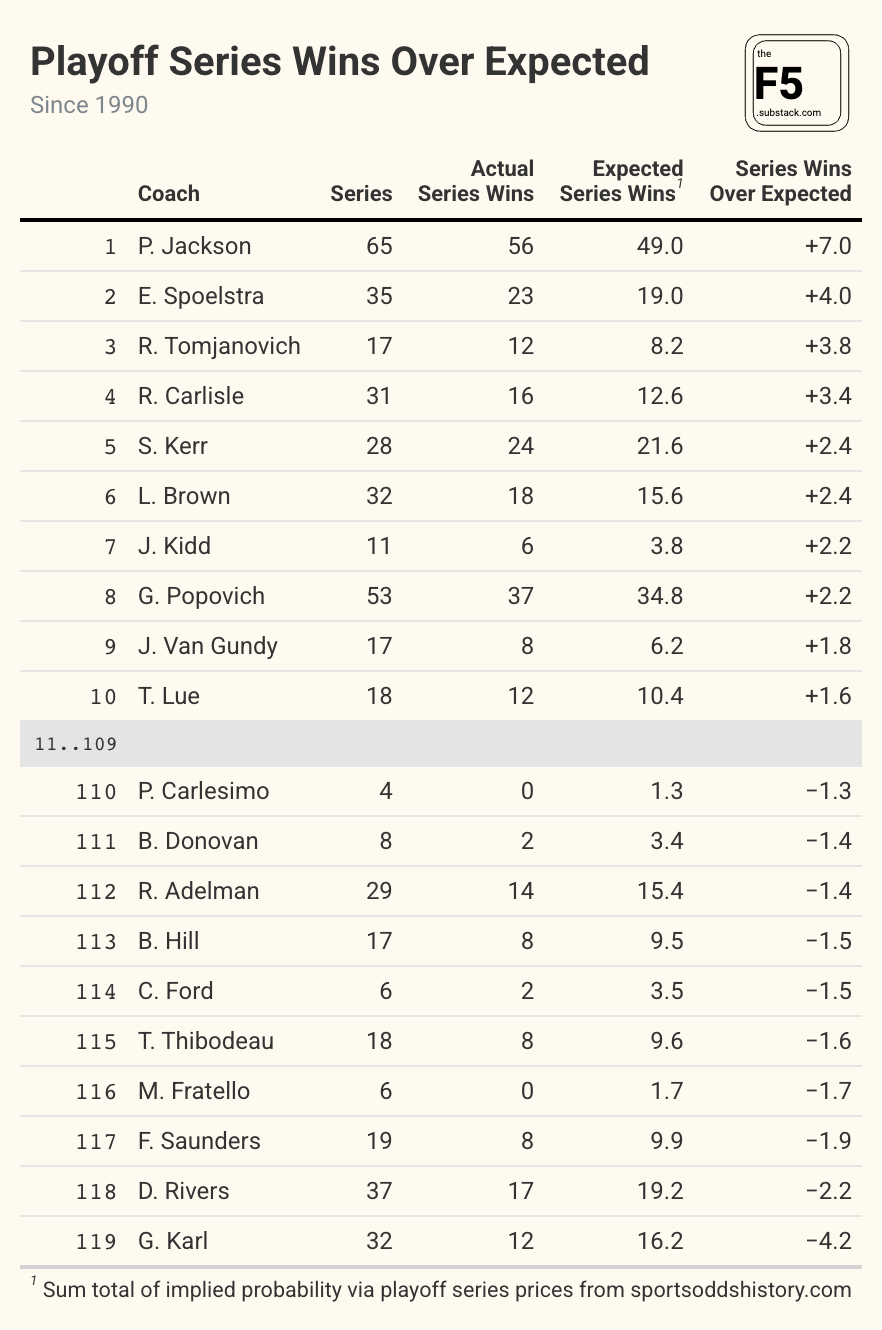
The first thing that jumps out is that the vast majority of coaches are only a point or so off from zero. In other words, Vegas is smart and does a good job of putting a price on playoff series. Go figure.
The second thing that jumps out is how Carlisle is currently fourth in total Series Wins Over Expected. The only head coaches with higher values are Phil Jackson, Rudy Tomjanovich, and Eric Spoelstra. That’s elite company to be in.
If Carlisle were to pull off the unlikely upset in this year’s Finals, he’d add another +0.84 in Series Wins Over Expected, which would firmly put him second place only behind Phil Jackson.
Some caveats:
For this analysis I’m using the prices that were listed before the series started. Injuries in the middle of the series could shift a team that started as a favorite to an underdog (or vice versa) which might overstate (or understate) a coach’s overall performance. For example, the 2012 Bulls coached by Tom Thibodeau were -1400 favorites against the Philadelphia 76ers. Then Derrick Rose tore his ACL in the first game and the Bulls lost the series in six games. That single series loss accounts for more than half of Thibodeau’s -1.6 Series Wins Over Expected.
I’m only looking at playoff series wins. A different approach that looks at individual playoff games won over expected might reveal different results.
These are merely descriptive values. That is to say these values are not necessarily predictive of a coach’s future performance in the playoffs.
Feet First
After Game 5 of Knicks-Pacers, Karl-Anthony Towns was interviewed by the TNT squad. Near the end of the interview Charles Barkley turned to KAT, who was wearing slides, and commented on how nice his feet are.
“You’re the only basketball player I know with good looking feet,” Barkley remarked.
That got me thinking, Does KAT actually have the best looking feet in the NBA?
To find out, I scraped the WikiFeet ratings6 of every active NBA player I could find and put them in a table below.

Not every NBA player has a WikiFeet profile, but enough do for me to conclude that KAT does not have the best looking feet in the NBA. In fact, KAT has the 31st ranked feet among NBA players with at least 10 ratings. That’s not bad for a big man, but it’s right around average for an NBA player with their own WikiFeet profile.
Funny enough, Charles Barkley (4.53) has a higher rating on WikiFeet than KAT does.
the first year that we have usage rate data
Michael Jordan’s usage rate was 34.7 on the 1993 Bulls. That’s 0.1 percent lower than SGA’s usage rate on the 2025 Thunder
as a percentage of their on court minutes on offense
vig removed
to give you an example, if a coach were involved in ten playoff series where they were 50-50 to win each series according to Vegas, then their total Expected Series Wins would be five.
wikifeet has this weird thing on their site where they display the average rating and the distribution of ratings (1-5). The numbers don’t match up so I just used the distribution of ratings to calculate what I think is the actual average rating
Donovan Mitchell: we out feeted Shai too
Love the analysis, love the visuals (and the R code articles to generate some of them when they up too). Got more than I bargained for looking up what wiki feet was though.
Great work, keep it up.