
Season Finale Thoughts
Some quick-hitters on OKC's historic season, the KD trade, and the draft.

The Oklahoma City Thunder are NBA champions.
They are also the all-time leader in point differential when you combine their regular season and playoff run.
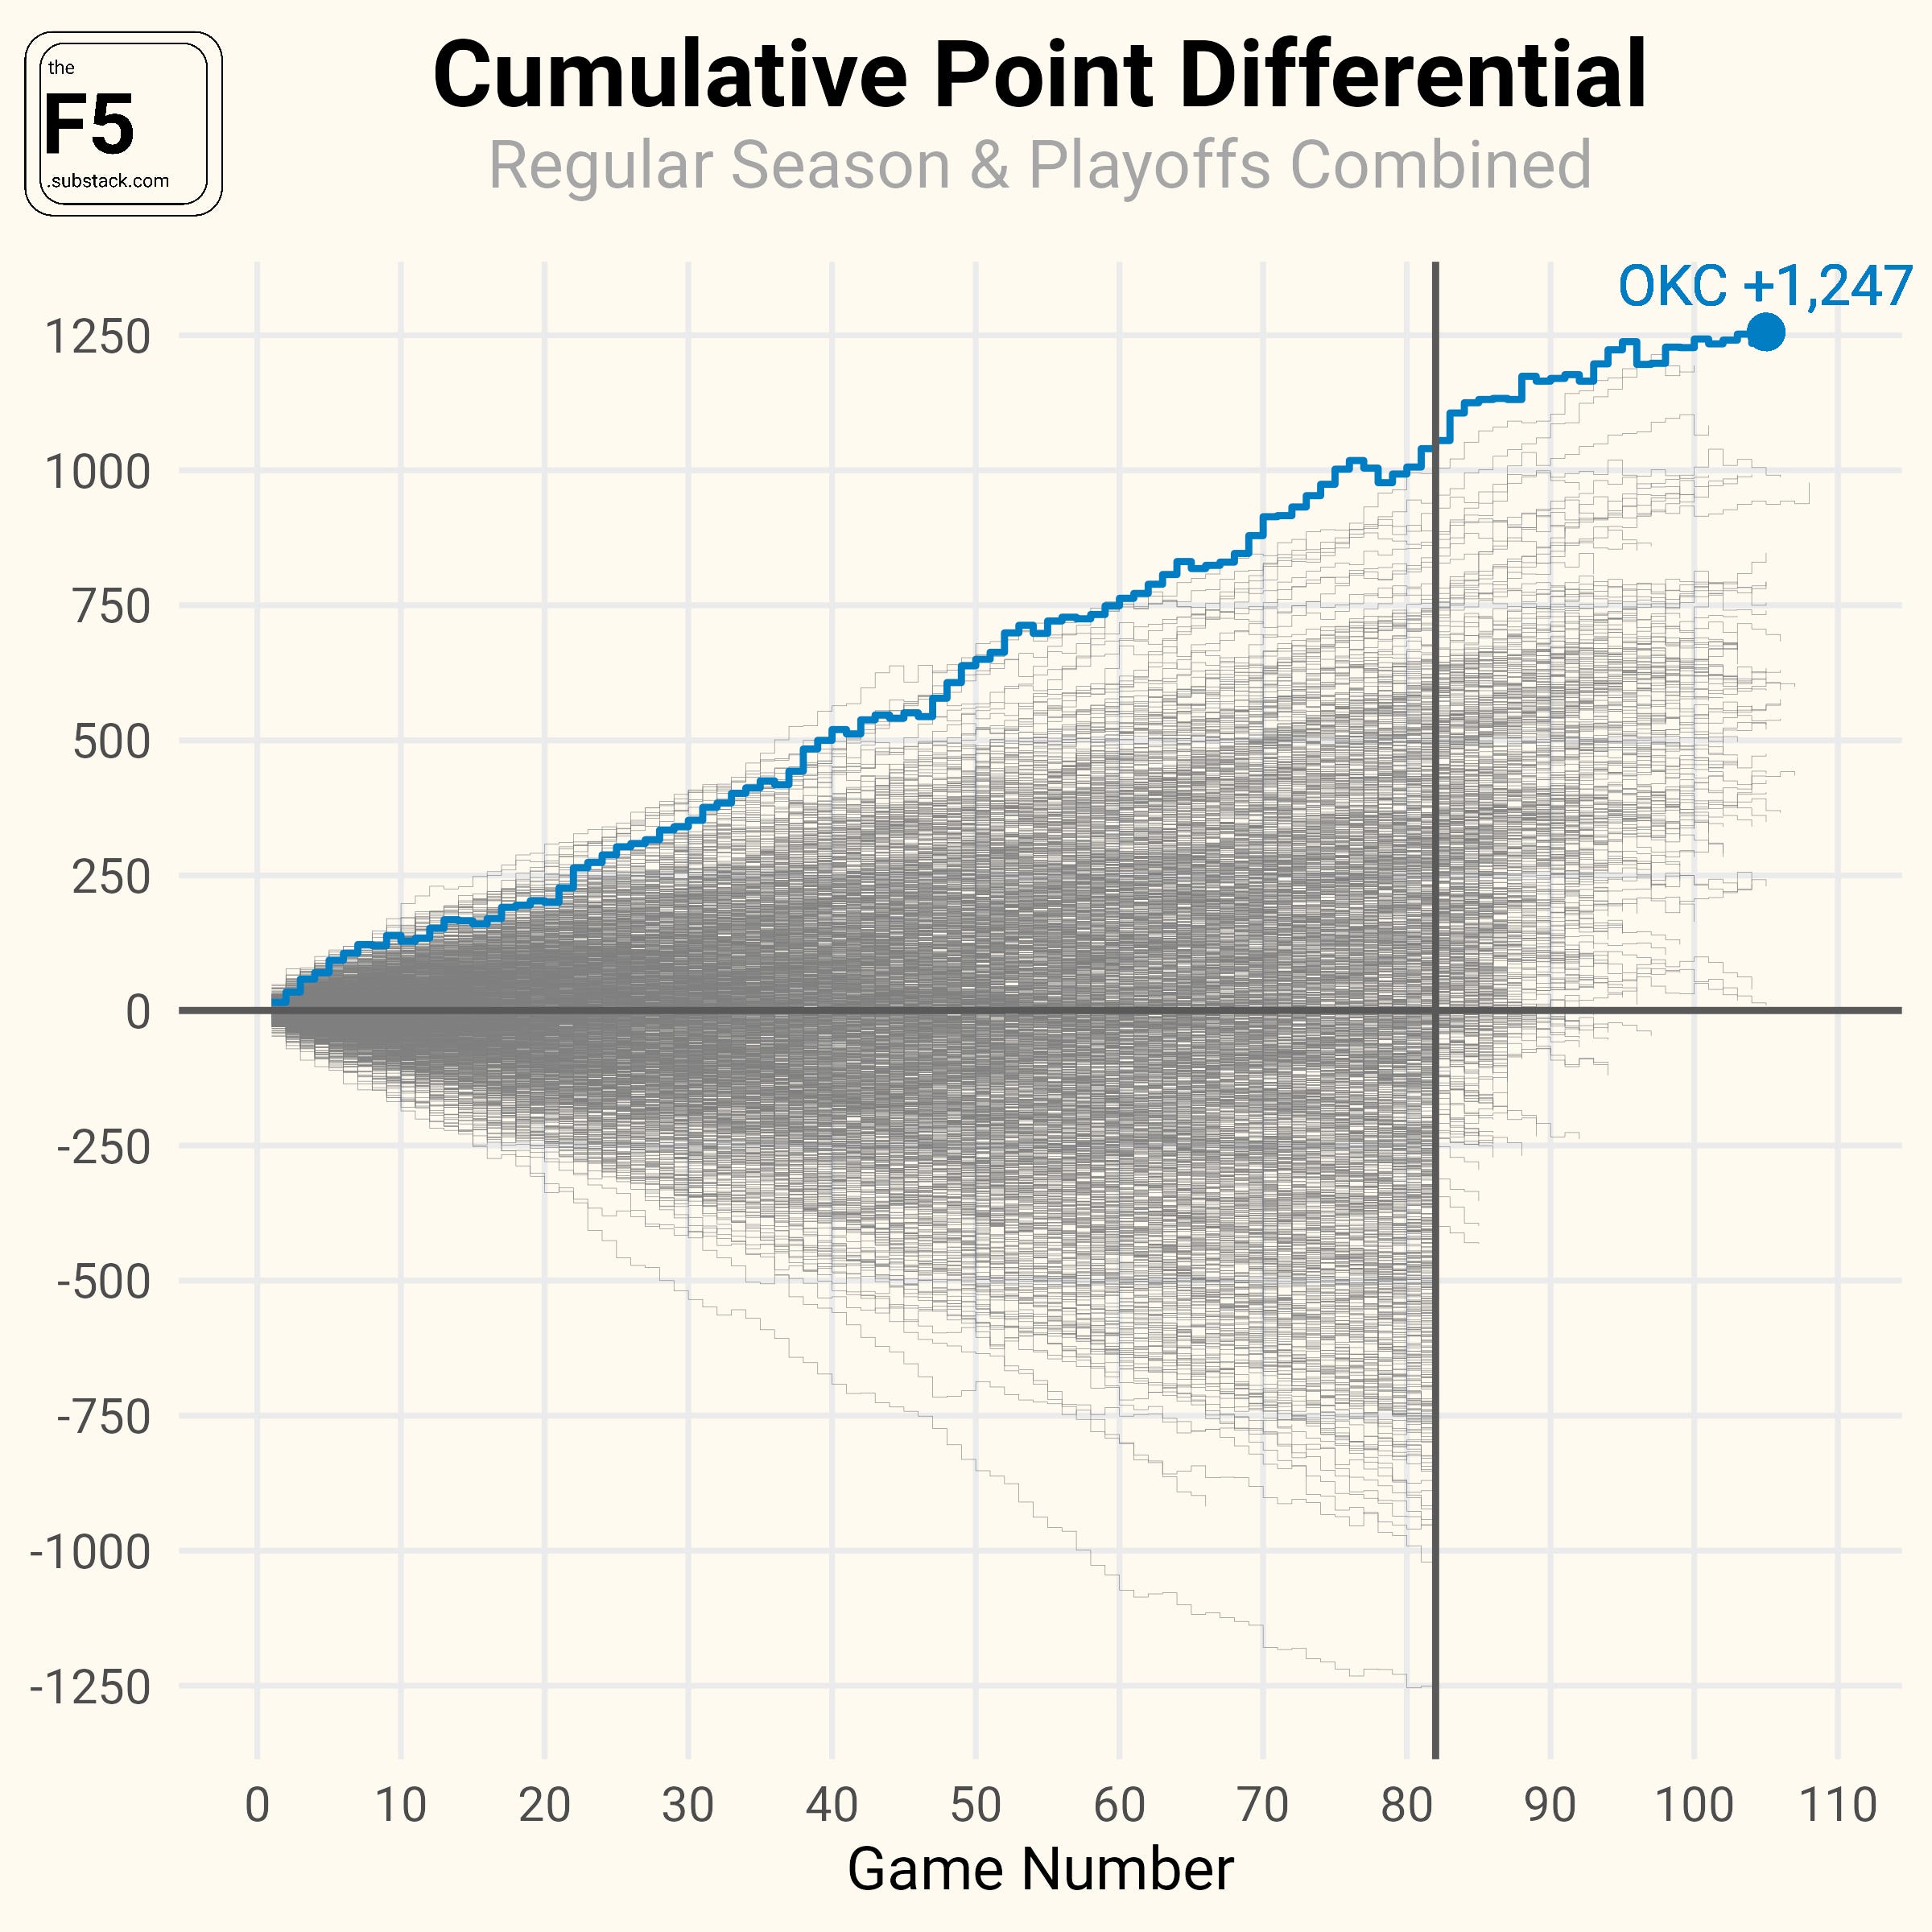
Does OKC’s record setting +1,247 point differential put them in the conversation as one of the most dominant teams of all time? I’m not so sure.
Point differential — the difference between how many points a team scores vs. how many they allow — is a simple and useful metric for evaluating team strength, but it loses some potency when you use it to compare teams across eras. There are more threes than ever before, which makes blowouts more common. If one team gets hot from beyond the arc and the other goes could The Diff could get to +30 rather quickly. This year alone there were 80 games decided by 30 or more points1.

Further, winning by 30 is not all that different than winning by 20. And yet, point differential sees it the same as the difference between winning by five points vs. losing by five points when we know that’s not true. Perhaps that’s why when Taylor Wyman of The Bball-Index looked to see which team metrics were most predictive of making the Finals over the last ten years, he found that good ole win percentage actually outperformed Adjusted Net Rating2.
It would not surprise me if there was also some version of Goodhart’s Law at play—when a metric becomes a target, it stops being a good measure. Coaches know they’re judged on their team’s point differential as much as their record. That awareness could encourage some coaches to use tactics that don’t actually make their teams better, just better-looking. Call it Net Rating maxing if you will.
To be clear, I thought OKC was the league’s best team from start to finish this year and are the rightful 2025 NBA champions. I’m just not ready to anoint them as the team of the decade or anything grander based solely on their historic point differential.
Houston, We Have An Upgrade
This season, there were 52 players that performed at least 250 isolation plays.
Kevin Durant ranked first in scoring efficiency, averaging 1.21 points per direct isolation according to tracking data from GeniusIQ.
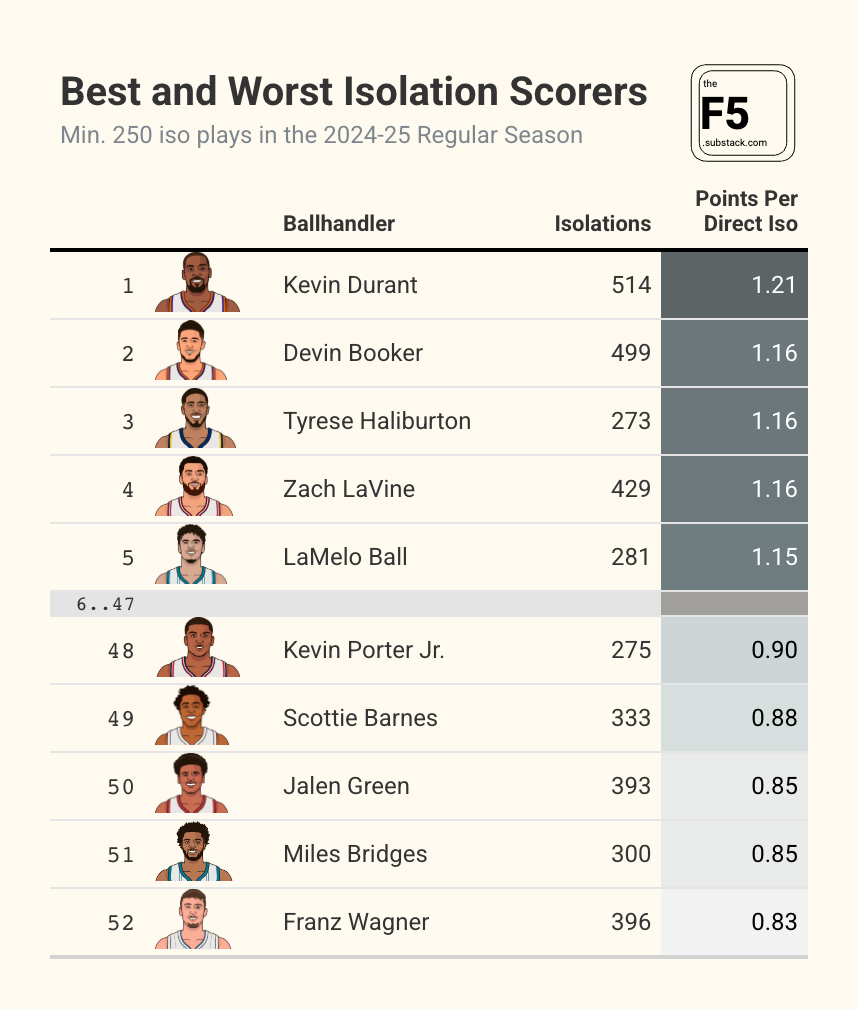
Jalen Green, the player Kevin Durant was just traded for, averaged 0.85 points per direct isolation. That was tied for the 2nd worst mark among qualifying players.
Smoke Screen Season
The only thing certain about the NBA draft is that no one knows anything.
To illustrate that point, I’ve charted the likelihood a player is selected with a given pick in the top ten of this year’s draft according to Vegas. The values shown are the implied probabilities3 from the Action Network’s consensus odds as well as the money line values in smaller text. So, for example, Cooper Flagg as an implied 97.7 percent chance of going first overall (-10,000 odds).

Outside of Flagg being drafted first overall and Dyan Harper likely going #2, the rest of the top ten is a mystery. VJ Edgecombe is the favorite to go #3, but it’s only somewhat better than a coin toss at this point (59.6 percent chance at being selected at #3).
Things will change in the days leading up to the draft as more intel leaks and smoke screens are deployed.
Blocked by Wemby
A few weeks ago, someone on Reddit asked what percentage of active NBA players has Victor Wembanyama blocked. So I looked it up.
Wemby has 430 career blocks, but many of those have come against the same player. For instance, Wemby has blocked Jaren Jackson Jr. 13 different times—more than any other player.
According the NBA’s play-by-play data, Wemby has blocked 205 different active NBA players in his two years in the league. There are 575 active players, which means Wemby has officially registered a block on over 35 percent of the league.
ICYMI
These charts appeared on my social media feeds. Reposting them here for posterity.
The stat I'll remember most about OKC’s championship run

Heliocentric basketball is now winning basketball

Just start the damn game

OKC was involved in eight of them
Net rating is just point differential after accounting for possessions played
with the vig removed
"some coaches to use tactics that don’t actually make their teams better, just better-looking." Made me think of college football
While Shai does have high usage rate, his iso driving style does differ a bit from the heliocentrism of guys like Harden and Luka who abuse pick and roll matchups. I wonder what the graph would look like using Offensive Load vs usage. Haliburton might also rank much higher, as he is sort of an unorthodox player in terms of taking shots.